Validation
This report sums up how far the results of acoustic_spaces can be trusted: what the test suite checks against theory on every change, how the simulation compares with another program, pyroomacoustics, and with measurements in two real rooms, how edge diffraction, reflections fading at edges and the reflection off a porous ground compare with the exact solution, how sound outdoors compares with measurements up to 845 m away, how its turbulence compares with a parabolic equation through random eddies, how its rays through vegetation compare with a separate particle simulation, how its wave solver in wind and temperature compares with a parabolic equation, how the weather’s effect behind barriers and buildings compares with a full-wave solution, and how much of a block’s time the real-time convolver needs. It ends with the known issues and what has not been validated yet.
Checks against theory, on every change
The test suite runs on Linux, macOS (Apple silicon and Intel) and Windows for every pull request and checks:
an 8 x 6 x 3 m box against analytic image sources up to 4th order (1, 6, 18, 38 and 66 paths), for both early methods and for symmetric placements where paths hit edges and corners: positions, delays and energies agree to rounding;
T30 in a box with fully diffusing surfaces against Eyring with air absorption: within 10 %, and slightly longer as absorption grows, as Kuttruff’s correction for the spread of free path lengths predicts; also within 10 % with the example’s uneven absorption (absorbing ceiling and carpet, hard walls) once every surface diffuses;
the decay in the same box with specular walls against its closed form, where each direction of travel meets the walls at its own fixed rate: within 10 % with the absorption spread evenly, and with the example’s, where rays parallel to the floor never meet the ceiling and T30 is 5 to 20 times Eyring’s estimate;
G in the same box against Barron’s revised theory: within 1 dB;
the statistical late method against the stochastic one in the same box, with the same absorption on every surface and scattering 0.3 and 1: G within 0.7 dB (up to 0.60 dB at scattering 0.3 and 0.43 dB at 1), C80 within 2.5 dB (higher from 1 kHz up, where the rays decay up to 7 % slower than Eyring);
the late tail of the example box (absorbing ceiling, smooth walls, random scattering) from 10k rays with splitting against 1 million rays: within 4 dB on average from 0.5 to 2.5 s, and splitting or thinning out every ray keeps the energy of plain ray tracing;
the late rays in batches: the same late energy as at once (to rounding without splitting; with it, a tipped split moved EDT by at most 0.2 %), and the batches’ mean is the late energy; standard errors (a jackknife over 10 batches, 2,000 rays, 30 seeds of a diffuse box) of EDT, T30, C80 and G against the spread of the parameters between the runs, from 125 Hz to 4 kHz: their ratio held within 0.6 to 1.6 band by band and 0.8 to 1.25 on average (over 60 seeds, the root mean square of the standard errors came within 0.90 to 1.17 of the spread); and they follow a source’s feed and new absorption (re-weighted) along with the rest;
the sums the package adds in a fixed order (
acoustic_spaces.products): every kind of product against the same sum added term by term in Python, bit for bit, on one and on several of its own threads, and against bit patterns stored with the tests, the same on every platform; the early pressure’s spectra and its coherent signal, the IACC and a decay line through 20,000 points bit for bit the same on one and on four threads of the linear-algebra library;a response’s decay times and ratios read the same however loud it is (20 gains, to 1e-9): the decay curve starts at 0 dB exactly, so EDT’s fit always starts at the onset;
the scattered sound of the reflections straight from the source, shared between the rays and the listeners’ gather (
tests/test_first_gather.py), on ground 400 m across: against its integral within 0.2 % for an aircraft 305 m up and 300 m off (over 24 seeds the shared runs spread by 0.08 % of it, the rays’ alone by 86 %, and these averaged half of it), and within the noise of 32 seeds for a source 30 m up and one 5 cm above the ground; the same as the rays’ alone within the noise through plants, from a source turned to the ground, per face group and arrival direction, and in two rooms through a partition and a doorway; each batch with its share of the gather’s directions; on the GPU as on the CPU;the late part’s last slots: the same rays traced 50 ms longer give the same echogram up to the end, where a ray’s time runs out as it crosses a listener’s sphere: with and without the rain on the CPU, without it on the GPU, and with rays bent by the wind on both;
scattering: the energy of an early reflection off a wall against Christensen and Rindel’s scattering of its size, to rounding; the early paths and the late part adding up to what the tracer finds on its own within 5 %, with vector-based and with random scattering; a box of tiny surfaces decaying at Eyring’s rate within 10 % where its smooth walls alone decay far slower; and a box that diffuses the bass and reflects the treble decaying at Eyring’s rate in the bass only, each band traced with rays of its own, with vector-based and with random scattering; off a reflector in free field, vector-based scattering bringing a listener out of the specular paths’ reach what random scattering brings, to rounding, and one in reach within 0.5 %;
third-octave bands: statistical runs in third octaves give the octave runs’ parameters within 1 % or 0.1 dB from 250 Hz up (within 5 % or 0.4 dB at 63 and 125 Hz, where the early paths add in pressure and three filters weigh their interference across an octave a little differently from one), and stochastic ones within the tracer’s noise; a 100 Hz third-octave absorber decays at its own Eyring rate (within 3 %) between bands that do not; the filter banks sum to their input and sit at -3 dB on the band edges;
sources: the free-field level 4 m from a source with a sound power per band, a gain and an equalizer, against 10 log10(4 π r²) and the air absorption of ISO 9613-1 (to rounding), with G unchanged by the feed; a delayed source’s response 12.5 ms later (600 samples at 48 kHz) with the same parameters, its wave bands too; two alike sources together 3 dB louder and as clear as one, and less clear with one of them 150 ms late; the speech spectra of IEC 60268-16 summing to 0 dB(A); and the STI of female speech, weighted to the treble, higher where the bass is blurred;
line and surface sources: a 40 m line’s free-field G at 2 and 4 m equal to the sum of its 80 points with their air absorption (to 1e-9 dB), falling 3.31 dB per doubling of distance as the continuous line does; an 8 x 8 m Lambert surface within 0.15 dB of the integral over the continuous square at 1 and 2 m, and silent behind; in the shoebox a 3 m line as loud as a point source whose paths add in energy, as the line’s uncorrelated points’ do (within 0.6 dB at 2000 rays per band) and its T30 within 10 % of the point source’s at 30,000 rays per band;
coherent arrays (their far-field patterns; nearer than L² f / c the room’s warnings say so unless the array adds up its elements one by one,
near_field): a column of 8 omnidirectional elements 20 cm apart against the analytic sums of a line array, its directivity index within 0.05 dB in all 24 third-octave bands (n² over the band mean of the pairs’ sin(kr)/kr) and its vertical pattern within 0.3 dB of the band-averaged |sin(Nψ/2)/sin(ψ/2)|² wherever that is above -15 dB; a steered column’s beam within 1 degree of its aim, and the same as delays given element by element; two close elements in opposite polarity a dipole (4.77 dB); two cardioids splayed ±30 degrees their exact first-order sum; and in a simulation, levels ahead of and above a column that differ by its pattern exactly;coherent arrays element by element (
near_field): a steered column of 8 cardioids 3 m from its centre against the sum of its elements’ pressures over 20,000 frequencies in each third-octave band, within 0.001 dB in all 24; 100 km away its pattern’s own weights (within 0.00001 dB); a 3.75 m column of 16 elements on axis losing 2.8 dB per doubling of the distance at 1 kHz from 1 to 32 m, inside the 41 m where its far field starts (3 dB for a line), and 6.02 dB from 128 m on (a point); and in a simulation, levels 4 m ahead of and above a 1.4 m column that differ from omni by the elements’ sum there exactly, ahead 9.5 dB below its far-field pattern at 4 kHz, where the beam has not formed yet;walls and openings: two 5 x 4 x 3 m rooms, 20 % absorbing, with a 12 m² partition between them reach the level behind it that diffuse-field theory gives, G = 10 log10(1600 π S τ / A²) with Eyring’s absorption area A, within 0.4 dB at R = 30 and 50 dB (0.1 to 0.2 dB at 3000 rays per band), and their level difference R + 10 log10(A / S) within 0.5 dB; two such rooms joined by an opening the size of the wall give the T30 (within 4 %), G (0.3 dB) and C80 (0.5 dB) of one 10 x 4 x 3 m room; and a dry room of 96 m³ opening through a 2 m² doorway into a live one of 192 m³ decays in the two slopes of the two-room diffuse model, within 1.5 dB of its decay curve down to -30 dB and its late reverberation time within 12 % of the model’s slow mode (within 1 dB to -40 dB and 5 % at 10,000 rays). Particles reach the next room straight through an opening and not through a closed door, and the wave solver’s air flows through the opening. The statistical method follows the two-room model within 0.3 dB of its decay curve from -20 to -40 dB in both rooms, and comes within 0.4 dB of the rays behind the partitions (0.2 dB below them: its field reaches each point from the direct sound on, as Barron has it). Coverage maps over both rooms find at their points what listeners there find (G, T30 and C80 within 0.01 with the statistical method), and the rays’ maps the level behind the partitions within 0.4 dB;
audience seating: the grazing attenuation against its fit’s own figures (17 dB at grazing incidence after 11 m, 6.3 dB at 5° and 4.8 dB at 7°, none from 17.8°, linear in dB with distance); the direct sound 18 m over seats at 0.95° 21.1 dB down in the 500 Hz to 2 kHz bands only, the ceiling reflection untouched; a balcony seat shaded only by its own seats and the front stalls the sound skims, not by the stalls far below; with the statistical method, a response that loses exactly what its early paths lose (the tail does not make it up); and a coverage map less clear and weaker over the middle of the seats;
fitting materials to measurements: a run re-weighted for other absorption against the room traced again with it (the same early paths, with the same energies and, where they add in pressure, the same phases to 10⁻¹², those of reflections on the way round an edge included; T30 within 4 %, EDT within 5 %, C80 within 0.3 dB and G within 0.1 dB; far from the traced absorption, a ceiling of 0.5 taken to 0.99, 0.9 or 0.1, T30 within 15 % and G within 0.25 dB); the late part’s exponent against the exact one for reflection counts that fall by chance; the absorption a simulated room was given recovered from its own responses within 0.05 in every band, and a shoebox’s walls within 0.015 from 500 Hz up, where the fit’s own uncertainty is below 0.05 and above 0.1 in the bands the measurements leave open; a third-octave material that keeps its shape; and the two BRAS rooms (see Measured rooms);
every ISO 3382-1 parameter on synthetic exponential decays, and the air absorption against the ISO 9613-1 table;
the further parameters against responses whose values are known: LF and LFC of one reflection from the side, from 45°, from behind and from above, exact from the echogram and within 0.01 from W and Y impulse responses; a third of diffuse late energy lateral (a half for LFC); LJ as the G of the late lateral energy; the T30 of each axis when front-back sound decays in 2 s and the rest in 1 s, exact from the echogram and within 5 % from noise; IACC of 1 for equal ears and ears 0.5 ms apart, and below 0.15 from 2 kHz for unrelated ones; stage support of known energies to rounding; STIPA of exponential decays against Houtgast’s closed form within 0.002, and within 0.01 of the STI; U50 against its definition; and the echo criteria of an echo as loud as the direct sound 100 ms later within 10 % of the jump of the centre time, below the 10 % audibility mark for a smooth decay, and for music an echo at 1, 1.4 or 2 kHz reaching the 50 % mark at the same level within 0.25 dB;
spatial outputs: SN3D spherical harmonics against closed forms and orthogonality, VBAP gains of unit power that point at the panned direction and are mirrored for a mirrored direction, the direct sound’s direction in first-order Ambisonics, the mono energy kept by panned layouts (direct sound within 1 %, late part within 5 %), a binaural render through flat HRTFs equal to the mono response, and the spherical head’s interaural delay (0.6 ms at the side); HRTFs interpolated between measured directions give the measured responses at those directions and, round the horizon a degree at a time, an interaural delay that moves by less than 50 µs per degree where the nearest measured response jumps by more than 150 µs; mixing pulses delayed by fractions of a sample keeps them flat within 0.5 dB up to 16 kHz, and the spherical head’s within 1 dB of the nearest measured response at 8 kHz; a ring of directions or half a sphere interpolates within itself and takes the nearest response outside; the rotation of a sound field of any order turns encoded plane waves exactly (to 1e-9), is orthogonal and composes;
rendering: the compiled FFT against NumPy, the real-time convolver and the offline convolution against direct convolution (float32 and float64 precision), resampling of tones within 1e-3 of the exact signal up to 15 kHz with nothing above the new Nyquist frequency left, and playback through a simulated sound card block by block;
edge diffraction: the UTD coefficient against Sommerfeld’s exact solution for a rigid half-plane (to 1e-8, also exactly on the shadow and reflection boundaries) and against the exact eigenmode series for wedges open over 225° to 315° (within 0.25 dB); a thin screen against Maekawa’s chart (within 1.5 dB), the same from either side; and the early level across the shadow boundary of an L-shaped room, in millimetre steps, continuous within 0.25 dB with first-order reflections where specular paths alone drop by more than 5 dB, and across the boundary of a reflection off one of the corner’s walls within 0.05 dB; over a 1 m thick barrier, the path over both corners against the exact BTM solution (within 1 dB, and 0.2 dB from 500 Hz up, the same both ways round; with faces absorbing 0.02, in pressure or in energy, within 1 dB of it too and, straight across the top, below the rigid block’s level by the Weyl-van der Pol ground wave’s loss along it worked out by hand, within 0.05 dB), and the level as the source and the listener rise through the plane of its top, continuous within 1 dB (0.1 dB from 1 kHz up); a thin screen’s diffracted wave in its lit zone, all four terms of the UTD within 0.2 %; and through
early_paths, next to the shadow boundary of a thin screen, of a right-angled corner and of a wedge open over 225°, against BTM: the bands that add in energy on the boundary as low as the known issues give (within 0.02 dB), and those in pressure within 0.08 dB;early reflections in pressure at low frequencies: an impulse response and the echogram it came from in a 7.3 x 5.1 x 3 m box without edge diffraction, early part alone, G within 0.02 dB, C50 within 0.05 dB and Ts within 0.3 ms at 63 and 125 Hz (G 2.1 dB and C50 1.6 dB apart when the paths add in energy); forty pieces of a diffracted wave within a millisecond rendering their energy within 0.2 of it from 250 Hz up on average over 100 seeds, where forty reflections of one phase render more than 20 times theirs at 250 Hz, and the echogram’s 63 and 125 Hz bands independent of how much the pieces carry above them; a source and a listener 0.3 m above a floor 10 m apart, the direct sound and the floor reflection 5.5 dB above the free-field level over a hard floor and 4 dB below it over an absorbing one at 63 and 125 Hz, the echogram within 0.3 dB of the paths’ pressures added; the phase of the reflection factor, none off a hard surface and half a turn off an absorbing one at grazing incidence; and a thin screen’s diffracted wave, with all four terms of the UTD added in pressure, to 1e-9;
the wave solver, with both stencils where both apply: the modes of a rigid box (within 0.6 Hz), both stencils’ modes along a tube at 12, 8 and 5 cells per wavelength as slow as their dispersion relation along an axis says (within 2e-5, the 19-point stencil’s error less than half the 7-point one’s), the 19-point stencil stable for 30,000 steps in a rotated room with a cube and a screen in it, both stencils’ highest modes 2⁻¹⁶ inside the stability limit (kicked, within 1.1 × 256 times the kick over 20,000 steps, rounded as the update rounds), the reflection off the end of a duct for four admittances (within 0.005, and below 0.05 for a matched end, and off the inner face of a wall thinner than a cell), and off an end whose admittance resonates (within 0.012 of the grid’s theory from 30 to 250 Hz); admittances fitted to four kinds of material (within 0.01 of their absorption in every band, passive); the free-field level of the 63 Hz band (within 0.5 dB of the rays 2.5 cells from the source and 0.1 dB from 5 cells on), the source and the listeners read between the cells’ centres (weights that give a cubic’s value exactly; next to a wall, a screen and a slot the cells on the point’s own side, linearly across the surface, none further than two cells from the point; the level of the direct sound 13 cells away within 0.06 dB wherever the two lie within their cells; along a wall at 45 degrees, no step over 0.4 dB; with a wall behind a listener three cells from the source, none over 0.2 dB), the 19-point stencil’s direct sound 12 cells along the cube’s diagonal (within 0.05 dB of a point source’s, also with a slower speed of sound, and 0.5 dB over it without the taps that undo the grid’s own gain), the arrival time and direction of the direct sound and the strength of its first-order field against a point source’s (within 0.06 dB 4 m away along a grid axis, a face diagonal and a body diagonal, with either stencil), the part of the source’s pulse before emission kept for a listener near the source (the direct sound’s band energies 0.5 and 1 m away within 0.01 dB whatever the source’s low-pass), a run that starts before emission lined up with one that starts at emission and is fed a delay shorter by the lead (the same field and energy per band and slot, exactly; at a rate where the lead is not a whole number of samples, the same field, within half a sample of its time), the source flat to the top of the highest band at 5 cells per wavelength (within 0.05 dB), the gradient’s second-order and one-sided differences where a point two cells or one cell from the listener is missing (exactly, along each axis), the points among the source’s own cells left out of a gradient on the 19-point grid (those nearer the source than the listener, and not where a wall leaves an axis no others; the gradient’s main axis within 8 degrees of the line to the source 0.6, 1 and 2.2 cells from it), the gradient at a listener just in front of a thin screen and at one 1.5 cells in front of it, taken on the listeners’ side, as in front of a solid block (within 1 dB and 0.5 dB), open models and thin screens (stable, and the sound leaves), the matched layer round an open model (what comes back 40 dB down or more, against a grid too large for anything to come back; stable for 9,500 steps; at 63 Hz the sound that runs along it 60 m over the ground under a sky 3 m up, 40 m along a strip of ground 3 m wide and 60 m under a plate within 0.05 dB of the same on a taller, wider or deeper grid; the room it leaves, in whole cells off the model, none under an outdoor ground and none on a side the model’s surfaces close, found by flooding the air once), one run for bands with their own absorption, and the level of the late part across the crossover to the rays (flat within 1 dB in sixth octaves);
the ray tracer against runs stored before its tree was rebuilt (
tests/reference/tracer.npz): the faces and distances the tree finds, the specular paths, and every kind of late run on the CPU to single precision, so a change that moves a result is seen; the same runs traced on a GPU (in CI, Mesa’s software Vulkan driver) land within the spread of the CPU’s own results over seeds, and the GPU’s ray searches find the CPU’s faces; outdoors the GPU’s chords through the atmosphere are the CPU’s ray for ray, and what its rays bent by the weather or scattered by plants bring to each listener agrees within the noise (see Outdoor scenes on the GPU);the leak finder: a closed model keeps every ray; a box without its ceiling reports one gap of 30 m² (6 x 5 m) with every ray through it, at the ceiling’s height; the example classroom’s two holes, the missing window pane in the east wall (3.6 m², 3.0 x 1.2 m) and the 3 cm slit along the ceiling’s edge (0.27 m²), each with the rays that crossed it inside it; a ceiling that lets sound through counted as an opening, not a leak; a source outside a closed model named; and no leak in the other examples;
walkthroughs: the places along a walk every 25 cm, facing forward and turning the shorter way round at the set pace; crossfade weights that add up to one; crossfades that are continuous, keep a tone heard a quarter or a third of a turn later at the next place to within 0.1 dB of its level, turn a tone in antiphase up by 6 dB at most, keep unlike noise’s power (to 0.2 dB) and correct each octave band by its own correlation; the late parts of the places between those traced mixed in proportion to the distance; one response everywhere equal to the plain convolution (to 1e-12); a walking listener, and a walking source heard at a listener; and the gallery walk rendered through its places;
models read from files: a room whose walls’ edges run past the floor’s corners (T-junctions, with or without the zero-area slivers SketchUp exports) cleaned into a closed room of the right volume and area; a wall’s edge running past the corner where three faces meet split there, and a sliver 1 µm high whose own corner splits the edge it closes dropped, not split into faces with a repeated corner; two rooms touching along an edge closed; a face given twice leaving the model open, with its odd edges counted; points inside a model whichever way its faces point; an IFC office read as one room from its space boundaries (closed, 75.6 m³) or as every element, in the file’s units; a Collada room in inches with its up axis as written, and instanced components placed by their nodes; and materials from CATT-Acoustic files and ODEON libraries, the latter as ODEON writes it (Windows encodings and six-band tables too);
outdoor scenes: over a flat ground under the open sky, exactly two paths, the direct sound and the ground’s reflection, at their distances and with the reflection’s energy (absorption, spreading and air) to rounding, from both early methods; a barrier’s top and ends as its only diffracting edges, with the shortest path over its top; no edge at the inside corner of an L-shaped building, whichever way its footprint runs; points inside buildings refused and left out of coverage maps; and responses that run
ir_length_spast the latest direct sound;grounds with an impedance: Miki’s and Delany and Bazley’s models at their constants, the two-parameter model’s closed form and a layer’s impedance; the spherical wave reflected whole off a hard ground, as the plane wave far from grazing and far away, and within 0.4 dB of the exact solution over grass, a thin layer of snow and gravel; the early part over grass within 0.05 dB of the spherical wave in every octave band, however large the ground; the points of a line source added in energy; a ground zone far past a reflection’s Fresnel zone changing nothing (to 1e-9), one under all of it the same as a ground of its own, and the change in between smooth; and the wave solver’s fit to an impedance within 0.05 of its reflection factor, from normal to near grazing incidence, and within 0.01 of its absorption;
vegetation: ISO 9613-2’s dense foliage to its table, a rigid cylinder’s scattering against the exact series’ small and large limits, and the depth through belts, hedges mitred at their bends and crowns; the early paths losing exp(-Σ μ l) along their legs to 1e-9; the late rays losing what a slab absorbs as Beer-Lambert has it (within 0.3 %), and upright stems meeting sound by its horizontal share (sound going up through a layer of them barely touches them); two bands traced with one set of rays as each traced alone (within 3 %); the rain of foliage and of stems against the detector spheres; and scenes without vegetation unchanged; leaves given by their area and width against a thin disc’s closed forms (the dipole of a small one to 0.2 %, twice the mean projected area of a large one, its mean cosine towards 1/2) and a rigid wall’s boundary-layer absorption (to 1e-12), per band as the mean over its frequencies, wider leaves of the same area taking more where their size nears the wavelength, and the early paths through a belt of them losing what the medium says (within 5 %);
the wave solver in wind and temperature: the grid’s own speed of sound in every cell giving the run without a speed per cell, to the bit (both stencils, with walls of frequency-dependent admittance); 0.8 times it giving sound that comes 1.25 times as late and as loud, its velocity as large next to its pressure; sound bent by a speed of sound that grows or falls by 65 m/s over 60 m arriving from 5 degrees above or below, within 12 % of the eigenrays’ angle; and the matched layer stable where the speed of sound halves with height and jumps across the grid;
sweep measurements of synthetic rooms through a distorting loudspeaker, with noise and interface latency: from 250 Hz up, the room’s response comes back with errors 30 dB below it and T30 within 3 %; with a noise floor 55 dB down, T30 stays within 5 % of the noise-free value.
outdoor results: the level relative to free field over grass against the exact spherical-wave reflection (within 0.05 dB from 1 kHz up, 0.75 dB in the band-filtered dip at 500 Hz), and over an absorbing ground that of free field; a barrier’s insertion loss the level relative to free field with its sign turned, with a reflection back on the source’s side that of its image source; the two runs sharing their seed, and maps giving the same at their points;
a terrain: heights read between the grid’s nodes bilinearly and past its edge as the edge’s, from ESRI ASCII grids (north row first) and XYZ points in any order; a flat terrain giving the flat ground’s early paths to the bit and a plane slope the reflection off the image source in it; the sound over a ridge the exact wedge’s (UTD against the Biot-Tolstoy-Medwin solution, within 0.1 dB over the source’s and the listener’s slopes); a smooth hill’s crest bending the sound, the level continuous as a listener climbs out of its shadow, over two hills each crest bending it in turn, a plane slope screening nothing and a building on the string stopping the path; buildings, barriers and vegetation standing on the terrain, zones taking its triangles, the extent keeping to it, coverage maps and insertion losses following it, footprints read from GeoJSON polygons and multipolygons, their holes built over and said so, and
inspectdescribing the terrain and the heights over the ground.
Cross-check against pyroomacoustics
pyroomacoustics 0.10.1 also simulates rooms with image sources for the early part and stochastic ray tracing for the rest, which makes it the open-source program closest to this one. Both simulated the same four rooms:
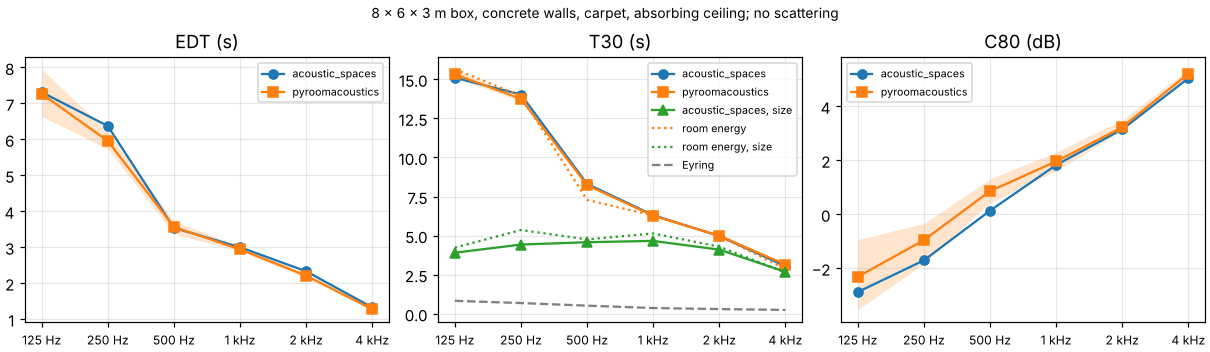
specular: an 8 x 6 x 3 m box with painted concrete walls, a carpeted floor and an absorbing tile ceiling, every surface reflecting specularly (no scattering);
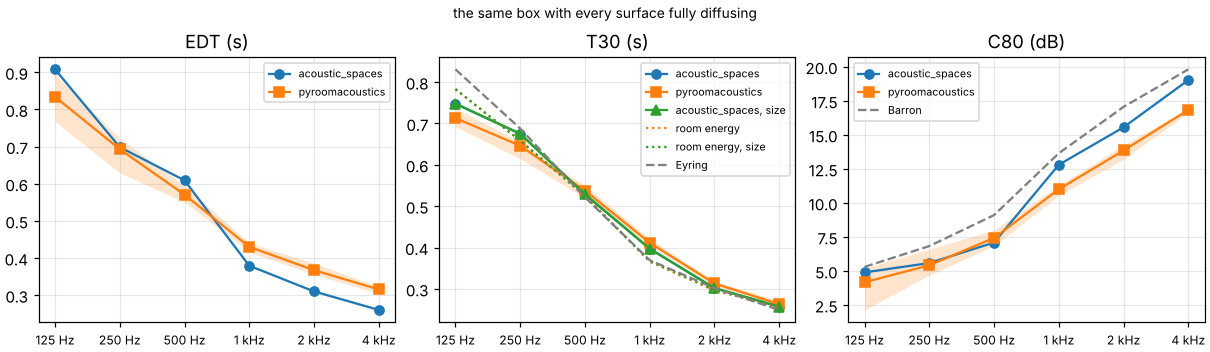
diffuse: the same box with every surface fully diffusing (scattering 1);
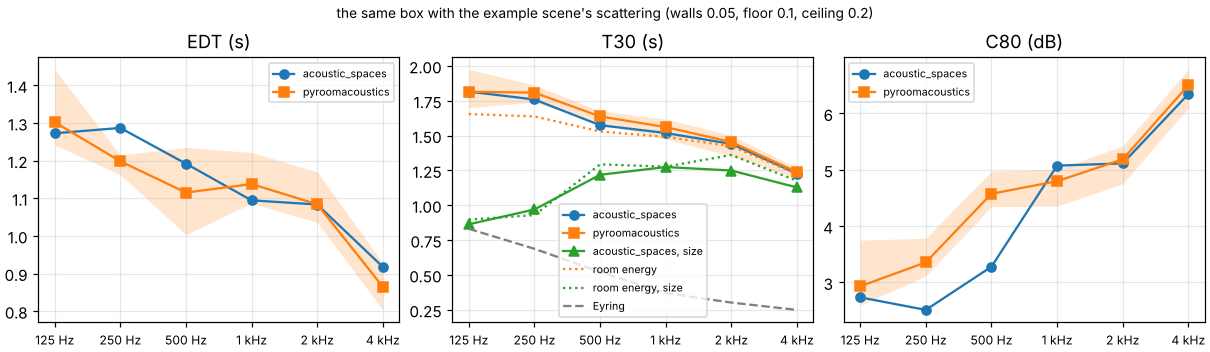
example: the same box with the example scene’s scattering: walls 0.05, floor 0.1, ceiling 0.2;
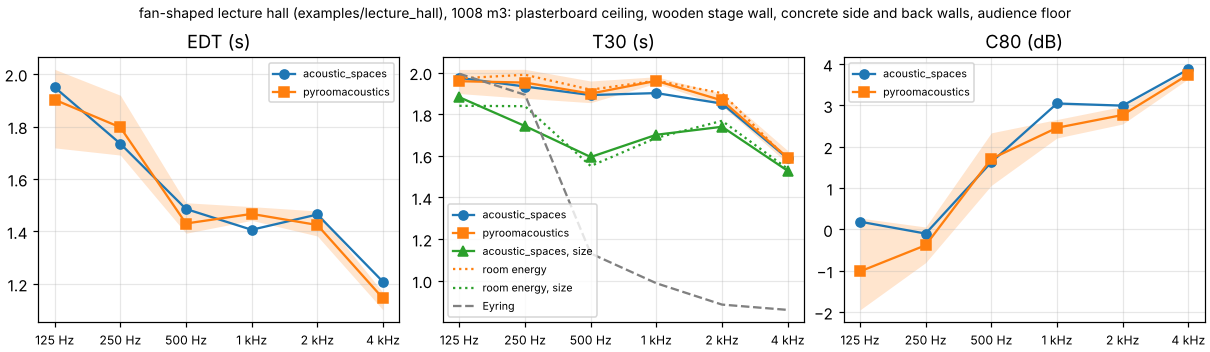
hall: the fan-shaped lecture hall of
examples/lecture_hall(1008 m³) with an audience floor (scattering 0.7), plasterboard ceiling, wooden stage wall and concrete side and back walls (scattering 0.1 to 0.15).
Both programs got the same absorption and scattering per octave band, the same air
absorption (ISO 9613-1 at 20 °C and 50 %, from this package), image sources up to the
3rd order and 100,000 rays, with one omnidirectional source and four listeners per room.
pyroomacoustics draws its rays afresh on every run, so each room ran five times in it:
the tables give the mean of the five and the spread between the highest and the lowest.
Both scatter vector-based. pyroomacoustics has no scattering from the size of a surface,
so this package left it out for the comparison (from_size: false) and ran each room
once more with its default, which adds it. Both sets of impulse responses were analysed
by the same code (acoustic_spaces.parameters.from_impulse_response), and EDT, T30 and
C80 were averaged over the four listeners, in the octave bands from 125 Hz to 4 kHz.
How the two programs differ
Reading the ray tracer of pyroomacoustics 0.10.1 (libroom_src/room.cpp) shows two
differences besides the scattering of a surface’s size:
How the listener receives scattered energy. Both programs send the scattered share of every reflection straight to each listener that can see the reflection point (“diffuse rain”). Here the detector sphere then counts only the rest of a ray’s energy. pyroomacoustics counts all of it at the sphere, so the scattered share reaches the listener twice, which raises the reverberant level, lengthens EDT and lowers C80.
One direction for all bands. pyroomacoustics turns a ray by the mean of the bands’ scattering coefficients; this package traces each band with rays of its own where the coefficients differ. In these four rooms they are the same in every band, so this makes no difference here.
The cross-check script also traces the total sound energy in each room without any listener, with either model, and fits T30 to the same stretch of its decay as the listeners’ T30 (“room energy” rows below).
Results
The figures show EDT, T30 and C80 per band for both programs, the spread of pyroomacoustics’ runs shaded, this package’s default with the scattering of the surfaces’ size, the decay of the room’s total energy under each model and, where a diffuse field makes them apply, Eyring’s reverberation time and Barron’s revised theory.
Specular box. The programs agree: T30 within 3 %, EDT within 7 % and C80 within 1 dB. Rays that travel parallel to the floor never meet the absorbing ceiling, so the decay is many times longer than Eyring’s estimate in both. Even a smooth wall is only 3 m high, though, and scatters what reaches it from far away or at a grazing angle: with that, T30 comes out 2.7 to 4.7 s instead of 3 to 15 s.
125 Hz |
250 Hz |
500 Hz |
1 kHz |
2 kHz |
4 kHz |
|
|---|---|---|---|---|---|---|
EDT (s), acoustic_spaces |
7.31 |
6.37 |
3.54 |
3.00 |
2.33 |
1.33 |
EDT (s), pyroomacoustics |
7.27 |
5.95 |
3.56 |
2.94 |
2.21 |
1.28 |
EDT (s), pyroomacoustics’ spread over 5 runs |
1.31 |
0.49 |
0.36 |
0.14 |
0.13 |
0.03 |
EDT difference |
-1 % |
-7 % |
+1 % |
-2 % |
-5 % |
-4 % |
T30 (s), acoustic_spaces |
15.10 |
14.03 |
8.31 |
6.31 |
4.98 |
3.05 |
T30 (s), pyroomacoustics |
15.32 |
13.75 |
8.23 |
6.27 |
5.00 |
3.15 |
T30 (s), pyroomacoustics’ spread over 5 runs |
0.51 |
0.21 |
0.11 |
0.07 |
0.04 |
0.04 |
T30 difference |
+1 % |
-2 % |
-1 % |
-1 % |
+1 % |
+3 % |
C80 (dB), acoustic_spaces |
-2.9 |
-1.7 |
0.1 |
1.8 |
3.1 |
5.0 |
C80 (dB), pyroomacoustics |
-2.3 |
-1.0 |
0.9 |
2.0 |
3.2 |
5.2 |
C80 (dB), pyroomacoustics’ spread over 5 runs |
2.6 |
1.5 |
0.9 |
0.7 |
0.4 |
0.2 |
C80 difference |
+0.6 dB |
+0.7 dB |
+0.7 dB |
+0.1 dB |
+0.1 dB |
+0.2 dB |
T30 (s), acoustic_spaces with surface size (default) |
3.91 |
4.43 |
4.58 |
4.66 |
4.10 |
2.69 |
T30 (s) of the room’s energy, vector-based scattering |
15.64 |
13.95 |
7.29 |
6.29 |
4.96 |
2.87 |
T30 (s) of the room’s energy, with surface size |
4.23 |
5.36 |
4.76 |
5.14 |
4.29 |
2.64 |
Eyring (s) |
0.83 |
0.69 |
0.52 |
0.37 |
0.30 |
0.25 |
Diffuse box. T30 agrees within 5 %; this package stays within 8 % of the room’s
energy decay and within 10 % of Eyring’s estimate, pyroomacoustics within 11 and 15 %.
From 1 kHz up, pyroomacoustics gives 13 to 21 % longer EDT and 1.7 to 2.2 dB lower C80
than this package, as its
double-counted scattered energy predicts. Barron’s revised theory sides with this
package: computed from the simulated energies, as simulate prints them, C80 is 0.6 to
1.0 dB below the theory in every band, where pyroomacoustics’ (from its impulse
responses) is 1.1 to 3.2 dB below it. From the impulse responses this package’s is about
0.5 and 1.2 dB lower again at 250 and 500 Hz (2.0 dB below the theory at 500 Hz), because
the direct sound and the first floor and ceiling reflections interfere within those
octave bands. Surfaces that diffuse fully
scatter no more for their size, so the default gives the same.
125 Hz |
250 Hz |
500 Hz |
1 kHz |
2 kHz |
4 kHz |
|
|---|---|---|---|---|---|---|
EDT (s), acoustic_spaces |
0.91 |
0.70 |
0.61 |
0.38 |
0.31 |
0.26 |
EDT (s), pyroomacoustics |
0.83 |
0.69 |
0.57 |
0.43 |
0.37 |
0.32 |
EDT (s), pyroomacoustics’ spread over 5 runs |
0.13 |
0.09 |
0.04 |
0.02 |
0.03 |
0.02 |
EDT difference |
-8 % |
-1 % |
-6 % |
+13 % |
+18 % |
+21 % |
T30 (s), acoustic_spaces |
0.75 |
0.67 |
0.53 |
0.40 |
0.30 |
0.26 |
T30 (s), pyroomacoustics |
0.71 |
0.65 |
0.54 |
0.41 |
0.31 |
0.26 |
T30 (s), pyroomacoustics’ spread over 5 runs |
0.04 |
0.04 |
0.03 |
0.02 |
0.01 |
0.01 |
T30 difference |
-5 % |
-4 % |
+2 % |
+4 % |
+4 % |
+2 % |
C80 (dB), acoustic_spaces |
4.9 |
5.6 |
7.1 |
12.8 |
15.6 |
19.0 |
C80 (dB), pyroomacoustics |
4.2 |
5.4 |
7.4 |
11.0 |
13.9 |
16.8 |
C80 (dB), pyroomacoustics’ spread over 5 runs |
3.1 |
1.9 |
1.2 |
0.7 |
1.0 |
0.3 |
C80 difference |
-0.7 dB |
-0.2 dB |
+0.3 dB |
-1.8 dB |
-1.7 dB |
-2.2 dB |
C80 (dB), Barron’s revised theory |
5.3 |
6.8 |
9.1 |
13.6 |
17.1 |
19.8 |
T30 (s), acoustic_spaces with surface size (default) |
0.75 |
0.67 |
0.53 |
0.40 |
0.30 |
0.26 |
T30 (s) of the room’s energy, vector-based scattering |
0.78 |
0.66 |
0.52 |
0.37 |
0.30 |
0.26 |
T30 (s) of the room’s energy, with surface size |
0.78 |
0.66 |
0.52 |
0.37 |
0.30 |
0.26 |
Eyring (s) |
0.83 |
0.69 |
0.52 |
0.37 |
0.30 |
0.25 |
Example box. With smooth walls (scattering 0.05), T30 agrees within 4 %, EDT within 7 % and C80 within 1.3 dB. Up to version 2 this package scattered a ray with the coefficient as probability, and pyroomacoustics’ T30 came out 19 to 42 % shorter. The walls’ size halves T30 at 125 and 250 Hz (0.86 s against 1.82 s) and shortens it by 8 to 22 % from 500 Hz up; each run matches the room-energy decay of its model within 11 %.
125 Hz |
250 Hz |
500 Hz |
1 kHz |
2 kHz |
4 kHz |
|
|---|---|---|---|---|---|---|
EDT (s), acoustic_spaces |
1.27 |
1.29 |
1.19 |
1.09 |
1.08 |
0.92 |
EDT (s), pyroomacoustics |
1.30 |
1.20 |
1.12 |
1.14 |
1.08 |
0.86 |
EDT (s), pyroomacoustics’ spread over 5 runs |
0.20 |
0.05 |
0.23 |
0.13 |
0.13 |
0.12 |
EDT difference |
+2 % |
-7 % |
-6 % |
+4 % |
+0 % |
-6 % |
T30 (s), acoustic_spaces |
1.82 |
1.76 |
1.57 |
1.52 |
1.44 |
1.23 |
T30 (s), pyroomacoustics |
1.81 |
1.81 |
1.64 |
1.56 |
1.45 |
1.24 |
T30 (s), pyroomacoustics’ spread over 5 runs |
0.27 |
0.12 |
0.09 |
0.14 |
0.15 |
0.07 |
T30 difference |
+0 % |
+3 % |
+4 % |
+3 % |
+1 % |
+1 % |
C80 (dB), acoustic_spaces |
2.7 |
2.5 |
3.3 |
5.1 |
5.1 |
6.3 |
C80 (dB), pyroomacoustics |
2.9 |
3.4 |
4.6 |
4.8 |
5.2 |
6.5 |
C80 (dB), pyroomacoustics’ spread over 5 runs |
1.2 |
0.7 |
0.6 |
0.7 |
0.7 |
0.7 |
C80 difference |
+0.2 dB |
+0.8 dB |
+1.3 dB |
-0.3 dB |
+0.1 dB |
+0.2 dB |
T30 (s), acoustic_spaces with surface size (default) |
0.86 |
0.97 |
1.22 |
1.27 |
1.25 |
1.13 |
T30 (s) of the room’s energy, vector-based scattering |
1.65 |
1.64 |
1.53 |
1.49 |
1.42 |
1.22 |
T30 (s) of the room’s energy, with surface size |
0.90 |
0.93 |
1.29 |
1.28 |
1.36 |
1.18 |
Eyring (s) |
0.83 |
0.69 |
0.52 |
0.37 |
0.30 |
0.25 |
Lecture hall. T30 agrees within 3 % and EDT within 5 %; pyroomacoustics’ C80 is up to 1.2 dB lower (at 125 Hz), the double-counted scattered energy again. The surfaces’ size shortens T30 by 4 to 16 %, in line with the room-energy decay of that model within 6 %.
125 Hz |
250 Hz |
500 Hz |
1 kHz |
2 kHz |
4 kHz |
|
|---|---|---|---|---|---|---|
EDT (s), acoustic_spaces |
1.95 |
1.73 |
1.49 |
1.41 |
1.46 |
1.21 |
EDT (s), pyroomacoustics |
1.90 |
1.80 |
1.43 |
1.47 |
1.42 |
1.15 |
EDT (s), pyroomacoustics’ spread over 5 runs |
0.30 |
0.23 |
0.12 |
0.05 |
0.10 |
0.07 |
EDT difference |
-2 % |
+4 % |
-4 % |
+4 % |
-3 % |
-5 % |
T30 (s), acoustic_spaces |
1.97 |
1.93 |
1.89 |
1.90 |
1.85 |
1.59 |
T30 (s), pyroomacoustics |
1.96 |
1.95 |
1.90 |
1.96 |
1.87 |
1.59 |
T30 (s), pyroomacoustics’ spread over 5 runs |
0.12 |
0.14 |
0.10 |
0.03 |
0.06 |
0.06 |
T30 difference |
-1 % |
+1 % |
+0 % |
+3 % |
+1 % |
+0 % |
C80 (dB), acoustic_spaces |
0.2 |
-0.1 |
1.6 |
3.0 |
3.0 |
3.9 |
C80 (dB), pyroomacoustics |
-1.0 |
-0.4 |
1.7 |
2.5 |
2.8 |
3.7 |
C80 (dB), pyroomacoustics’ spread over 5 runs |
2.2 |
0.9 |
1.3 |
0.4 |
0.4 |
0.2 |
C80 difference |
-1.2 dB |
-0.3 dB |
+0.1 dB |
-0.6 dB |
-0.2 dB |
-0.1 dB |
T30 (s), acoustic_spaces with surface size (default) |
1.88 |
1.74 |
1.59 |
1.70 |
1.74 |
1.53 |
T30 (s) of the room’s energy, vector-based scattering |
1.97 |
1.99 |
1.92 |
1.96 |
1.90 |
1.58 |
T30 (s) of the room’s energy, with surface size |
1.84 |
1.84 |
1.55 |
1.69 |
1.77 |
1.54 |
Eyring (s) |
1.99 |
1.89 |
1.13 |
0.99 |
0.88 |
0.86 |
Conclusions
With the same scattering model, the programs agree within 5 % on T30 in all four rooms, from purely specular to fully diffusing surfaces, and within 8 % on EDT where pyroomacoustics’ double counting does not lengthen it. That is close to the 5 % and 1 dB the plan aimed for. With 100,000 rays, pyroomacoustics’ own runs differ by up to 15 % in T30, 21 % in EDT and 3.1 dB in C80, most often at 125 Hz, which is why the tables average five of them; this package’s numbers move by a few percent with the seed.
Where the theory is clear (the diffuse box), this package agrees with Eyring (T30 within 10 %) and with Barron’s revised theory (C80 from the energies within 1.0 dB); pyroomacoustics counts the scattered energy twice.
The scattering of a surface’s size, which pyroomacoustics lacks, shortens the decay of rooms with smooth walls a lot at low frequencies and less at high ones. Measurements, not another program, decide whether it helps: in the two measured rooms below it does.
Measured rooms (BRAS)
The Benchmark for Room Acoustical Simulation (BRAS; Aspöck, Brinkmann, Ackermann,
Weinzierl and Vorländer, 2020, DOI
10.14279/depositonce-6726.3, CC BY-SA 4.0)
measured real rooms and published their models, the absorption and scattering of their
surfaces, and the impulse responses. Four of its rooms are in validation/bras as
scenes (its README says how they were made):
CR1, two coupled rooms, a laboratory of 102 m³ and a reverberation chamber of 121 m³, with the door between them open by 4.1° and, a scene of its own, by 30.4°, four materials. In BRAS’s model with the door at 30.4° the door leaf runs 24 mm into the wall at its hinge, which leaves the model without an inside; the conversion joins the leaf to the wall and the floor;
CR2, a seminar room of 146 m³ with five surface materials;
CR3, a chamber music hall of 3331 m³ with upholstered seating, stage panels and structured plaster, seven materials;
CR4, an auditorium of 8657 m³ with eight materials.
In CR2, CR3 and CR4 a dodecahedron loudspeaker stood at two positions and an
omnidirectional microphone at five, giving ten measured responses in each. In CR1 the
loudspeaker stood once in each room (LS1 in the chamber, LS2 in the laboratory) and the
microphone at two positions in the laboratory, giving four. Each scene was simulated as
it stands, with this package’s defaults: ray tracing up to the 3rd order, first-order
edge diffraction, 50,000 late rays per band and vector-based scattering with the
scattering of each surface’s size, in the air measured on the day. Simulated and
measured parameters were compared pair by pair in just noticeable differences
(acoustic_spaces.compare, the same JNDs as acoustic-spaces compare) and averaged
over the pairs, in CR1 over each source’s. The measured responses were analysed by this
package too. Its octave values, averaged over the ten pairs, are within 3 % of the mean
of the three third-octave averages BRAS publishes for T20, within 5 % for EDT and within
0.8 dB for C80, from 500 Hz to 4 kHz in CR2, CR3 and CR4 (the largest differences are
EDT 4.3 % lower in the hall at 500 Hz and C80 0.8 dB higher in the auditorium at 500 Hz
and 1 kHz; elsewhere within 3.8 % and 0.6 dB). BRAS publishes none for CR1. Below 500 Hz
the octave holds three third-octave bands whose values differ a lot, so averaging them
is not the same analysis. G is compared from seat to seat, as the level of the measured
responses is uncertain by about 3 dB (see Strength below).
The tables and plots in this section were made with this version on 29 and 30 October 2026 (the coupled rooms with the door at 30.4° on 2 November), on 4 cores of a cloud machine without a GPU, where the run times below were measured with each run alone on the machine (the coupled rooms’, the seminar room’s and the auditorium’s in a second run on 30 October, which gave the same numbers). The coupled rooms, the seminar room and the auditorium each run in 2 to 4 minutes and 0.7 to 1.1 GiB (4 to 9 minutes calibrated, 5 to 11 minutes and up to 1.2 GiB in third-octave bands); the hall takes 1.5 hours and 10.0 GiB (5.2 hours and 10.5 GiB calibrated, 3.4 hours and 11.8 GiB in third-octave bands), nearly all of it the early stage’s edge diffraction at one listener (see Memory). 4.0.0 could not run the seminar room or the hall at their defaults: its early stage asked for 16.4 GiB at once in CR3 and 19.6 GiB in CR2.
BRAS gives two sets of absorption coefficients. The fitted set was adjusted until
Eyring’s formula gave the measured reverberation time (in CR1 for each of the two rooms
on its own); the scenes use it. The initial set is BRAS’s estimate before that, from
tables and measurements of the materials, which is the blind case (--materials initial).
Mean absolute difference from 125 Hz to 4 kHz in JNDs (for G in dB, the JND being 1 dB), and how many of the pair and band values are within one JND: of 60 in CR2, CR3 and CR4, of 24 in CR1 at each angle of the door (23 for T30 at 4.1°, which one of LS1’s responses does not decay far enough for at 125 Hz). With the fitted absorption:
CR1, 4.1° |
CR1, 30.4° |
CR2 |
CR3 |
CR4 |
|
|---|---|---|---|---|---|
EDT |
7.8 (2) |
7.6 (1) |
1.0 (44) |
2.0 (20) |
3.7 (3) |
T20 |
6.7 (1) |
4.6 (2) |
1.0 (41) |
2.0 (9) |
3.0 (1) |
T30 |
7.7 (0) |
3.8 (5) |
1.0 (43) |
1.8 (9) |
3.0 (0) |
C50 |
4.3 (1) |
2.0 (6) |
1.0 (41) |
1.2 (34) |
1.3 (29) |
C80 |
4.0 (1) |
2.5 (5) |
0.7 (52) |
1.0 (40) |
1.3 (26) |
D50 |
4.1 (1) |
2.0 (5) |
1.0 (39) |
1.3 (31) |
1.3 (28) |
Ts |
3.6 (2) |
5.0 (0) |
0.8 (41) |
1.0 (33) |
2.5 (9) |
G, seat to seat |
1.8 (5) |
0.6 (20) |
0.3 (53) |
0.6 (52) |
0.5 (50) |
With the initial absorption:
CR1, 4.1° |
CR1, 30.4° |
CR2 |
CR3 |
CR4 |
|
|---|---|---|---|---|---|
EDT |
16.3 (0) |
13.1 (1) |
5.9 (6) |
4.8 (8) |
4.0 (8) |
T20 |
11.0 (1) |
6.3 (0) |
6.5 (1) |
5.8 (12) |
3.7 (13) |
T30 |
5.6 (4) |
8.1 (1) |
6.5 (0) |
5.7 (11) |
3.8 (10) |
C50 |
6.1 (3) |
2.9 (7) |
1.6 (24) |
1.5 (23) |
1.6 (24) |
C80 |
6.0 (4) |
3.5 (5) |
1.7 (28) |
1.4 (26) |
1.5 (27) |
D50 |
5.9 (3) |
2.9 (6) |
1.7 (23) |
1.6 (21) |
1.7 (24) |
Ts |
12.5 (4) |
5.7 (4) |
3.3 (14) |
2.2 (22) |
2.8 (16) |
G, seat to seat |
2.9 (2) |
1.2 (10) |
0.3 (54) |
0.6 (51) |
0.5 (50) |
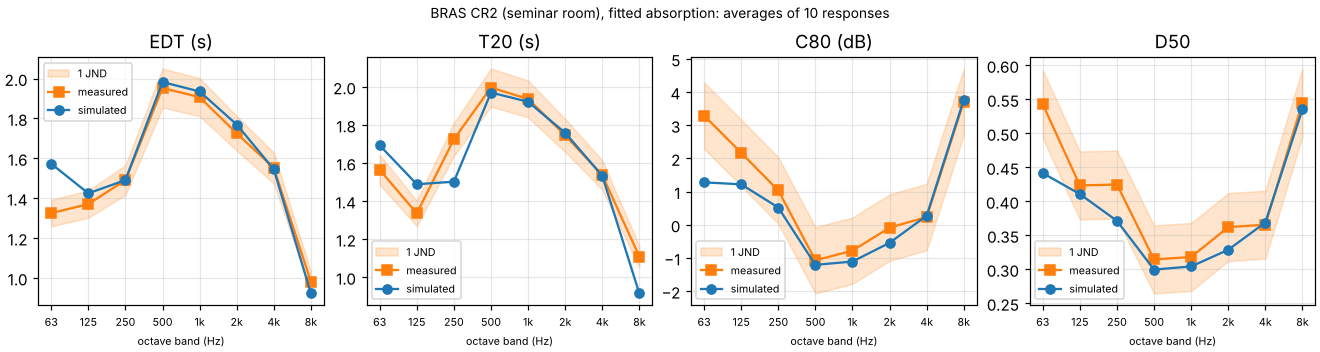
Seminar room, fitted absorption. From 500 Hz to 4 kHz the reverberation time is within 2 % of the measured one (T20 1.92 s against 1.94 s at 1 kHz), well within one JND, and C50, C80 and D50 are within one JND from 500 Hz up. At 250 Hz and 8 kHz the simulated decay is 13 and 18 % short, and so is Eyring’s formula with the same absorption and air (1.48 s against 1.72 s measured at 250 Hz, 0.93 s against 1.11 s at 8 kHz), so there the fitted coefficients, averaged onto octaves, do not give the measured decay even in a diffuse field. At 8 kHz they assume less air absorption than ISO 9613-1 gives at the octave’s centre frequency; a measured decay follows the octave’s slowest part, its lowest third (6.3 kHz). Simulated in third-octave bands, which keep both apart, the two bands come within 4.1 % of the measurement (see the third-octave results below).
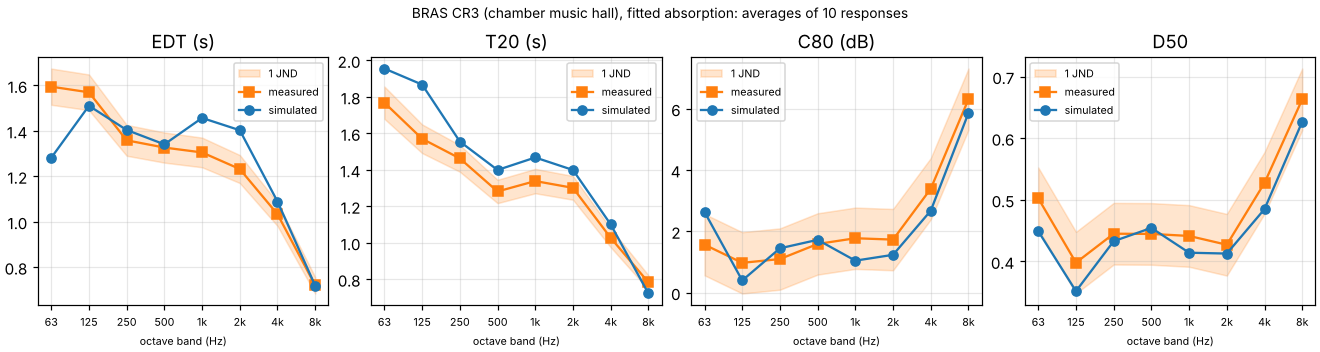
Chamber music hall, fitted absorption. The reverberation time comes out 6 to 10 % long from 250 Hz to 4 kHz (T20 1.47 s against 1.34 s at 1 kHz), 1.3 to 1.9 JNDs, and 11 and 19 % long at 63 and 125 Hz. EDT is within 3.8 % at 125, 250 and 500 Hz and 5 to 14 % long from 1 to 4 kHz, but 20 % short at 63 Hz, where the early part is stronger than measured (see the next paragraph). From 125 Hz up, C50, C80 and D50 are within about one JND, mostly slightly low, as a slightly long decay predicts. Eyring’s formula with the same absorption and air is within 5.1 % of the measurement from 63 Hz to 4 kHz, as the fitting intends. That the model decays more slowly suggests that in it sound reaches the absorbing seating a little less often than Eyring’s diffuse field assumes; why the real hall decays as Eyring’s formula gives and the model does not is not traced (the simplified BRAS model, which smooths the hall’s details away, is one candidate).
The hall’s early part at low frequencies. At 125 Hz C80 is 0.6 dB low and EDT 3.8 % short; at 63 Hz the early part is too strong (C80 1.1 dB high, EDT 3.6 JNDs short).
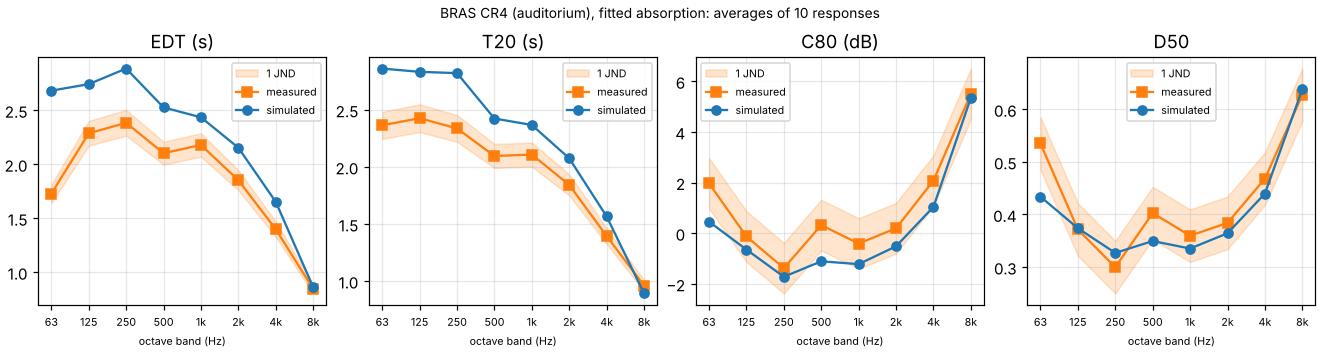
Auditorium, fitted absorption. The decay comes out 12 to 21 % long from 125 Hz to 4 kHz (T20 2.37 s against 2.11 s at 1 kHz), 2.5 to 4.2 JNDs, and EDT 12 to 21 % long too. Eyring’s formula with the same absorption and air is within 5 % of the measured T20 from 63 Hz to 4 kHz, so here too the fitting did what it intends; that the model decays more slowly still suggests that its sound reaches the absorbing surfaces less often than Eyring’s diffuse field assumes, more so than in the hall (see “Calibrated absorption” below). C50, C80 and D50 are within about one JND from 125 Hz up (C80 1.4 JNDs low at 500 Hz), and like the hall’s mostly low. At 8 kHz the decay is 7 % short, as in the seminar room: Eyring’s formula with the same absorption and air gives 0.82 s against 0.96 s measured.
What scattering does. Up to version 2 this package scattered a ray with the
coefficient as probability, and from the surface’s own coefficient alone. The hall then
came out 20 to 32 % long, EDT 11 to 24 %, and the seminar room 0 to 10 % long from 250
Hz to 4 kHz. Tracing the total sound energy in each room without listeners, as the
cross-check above does, and fitting T20 to its decay shows what each part of the new
model does (validation/bras_room_energy.py: 20,000 rays from LS1,
seed 0). The two vector-based models trace each band with rays of its own; random
scattering, as version 2 did, traces one ray for all bands and re-weights each band by
its own coefficient, which makes it noisier: with another seed its row moves by up to
8 % (the hall at 63 Hz), the others by up to 1.3 %.
T20 (s) |
63 Hz |
125 Hz |
250 Hz |
500 Hz |
1 kHz |
2 kHz |
4 kHz |
8 kHz |
|---|---|---|---|---|---|---|---|---|
CR2 measured |
1.56 |
1.34 |
1.72 |
2.00 |
1.94 |
1.75 |
1.54 |
1.11 |
CR2 room energy, random scattering (version 2) |
1.51 |
1.49 |
1.70 |
2.17 |
2.06 |
1.83 |
1.60 |
0.97 |
CR2 room energy, vector-based scattering |
1.57 |
1.41 |
1.51 |
1.82 |
1.79 |
1.66 |
1.44 |
0.90 |
CR2 room energy, vector-based with surface size (default) |
1.69 |
1.49 |
1.50 |
1.97 |
1.92 |
1.76 |
1.53 |
0.91 |
CR2 Eyring |
1.45 |
1.34 |
1.48 |
2.00 |
1.95 |
1.76 |
1.59 |
0.93 |
CR3 measured |
1.77 |
1.57 |
1.46 |
1.28 |
1.34 |
1.30 |
1.03 |
0.78 |
CR3 room energy, random scattering (version 2) |
2.11 |
2.01 |
1.77 |
1.60 |
1.63 |
1.56 |
1.18 |
0.74 |
CR3 room energy, vector-based scattering |
2.11 |
1.95 |
1.69 |
1.51 |
1.52 |
1.43 |
1.11 |
0.74 |
CR3 room energy, vector-based with surface size (default) |
2.03 |
1.89 |
1.63 |
1.40 |
1.47 |
1.40 |
1.12 |
0.74 |
CR3 Eyring |
1.79 |
1.65 |
1.49 |
1.28 |
1.33 |
1.33 |
1.06 |
0.71 |
From 500 Hz to 4 kHz, vector-based scattering alone takes the hall from 15 to 25 % long down to 8 to 18 %, but makes the seminar room 5 to 9 % short. Adding the scattering of each surface’s size brings the seminar room within 2 % of the measurement (and within 4
rooms better than either did. The simulated responses decay like these room-energy curves, within 0.2 % in the seminar room and 4.8 % in the hall in every band. The rest of the hall’s gap is not traced further (see the hall’s fitted absorption above). Fitting the absorption with this tracer instead of Eyring’s formula takes up that gap, in the hall and in the auditorium (see “Calibrated absorption” below).
Third-octave bands. BRAS gives its coefficients in third octaves. Averaged onto
octaves, an octave’s three thirds decay as one, at their mean absorption, while three
decays at different rates decay together more slowly than that, as the measured octave
does. Simulated with simulation.bands: third_octave, which keeps the thirds apart
(bras_validation.py --bands third_octave), T20 in each octave band:
T20 (s) |
63 Hz |
125 Hz |
250 Hz |
500 Hz |
1 kHz |
2 kHz |
4 kHz |
8 kHz |
|---|---|---|---|---|---|---|---|---|
CR2 measured |
1.56 |
1.34 |
1.72 |
2.00 |
1.94 |
1.75 |
1.54 |
1.11 |
CR2 octave bands (default) |
1.69 |
1.49 |
1.50 |
1.97 |
1.92 |
1.76 |
1.53 |
0.91 |
CR2 third-octave bands |
1.77 |
1.51 |
1.65 |
1.98 |
1.92 |
1.78 |
1.51 |
1.07 |
CR3 measured |
1.77 |
1.57 |
1.46 |
1.28 |
1.34 |
1.30 |
1.03 |
0.78 |
CR3 octave bands (default) |
1.96 |
1.87 |
1.55 |
1.40 |
1.47 |
1.40 |
1.10 |
0.72 |
CR3 third-octave bands |
2.00 |
1.90 |
1.57 |
1.40 |
1.46 |
1.40 |
1.13 |
0.80 |
CR4 measured |
2.36 |
2.43 |
2.34 |
2.10 |
2.11 |
1.84 |
1.39 |
0.96 |
CR4 octave bands (default) |
2.86 |
2.83 |
2.82 |
2.42 |
2.37 |
2.07 |
1.57 |
0.89 |
CR4 third-octave bands |
2.96 |
2.92 |
2.87 |
2.45 |
2.38 |
2.07 |
1.63 |
1.03 |
The seminar room’s decay at 250 Hz and 8 kHz, 13 and 18 % short in octave bands, comes within 4.1 % of the measurement: there its thirds’ absorption, and at 8 kHz the air’s, differ most. The hall’s 8 kHz goes from 8 % short to 2 % long, and the auditorium’s from 7 % short to 7 % long. From 500 Hz to 2 kHz T20 changes by 0.03 s at most. At 63 and 125 Hz the rooms come out 1 to 5 % longer than in octave bands, and the hall at 4 kHz 10 % long instead of 7 %. Over 125 Hz to 4 kHz the seminar room’s mean T30 difference goes from 1.0 to 0.9 JNDs; the hall’s goes from 1.8 to 2.1 and the auditorium’s from 3.0 to 3.5, since their decays were long already and third octaves lengthen them. In the coupled rooms with the door at 4.1° they lengthen the decay of LS1’s sound further (T20 13.8 s at 125 Hz against 12.1 s in octave bands and 6.7 s measured). A third-octave run takes 10 and 11 minutes for the seminar room and the auditorium instead of 4, and 3.4 hours for the hall instead of 1.5.
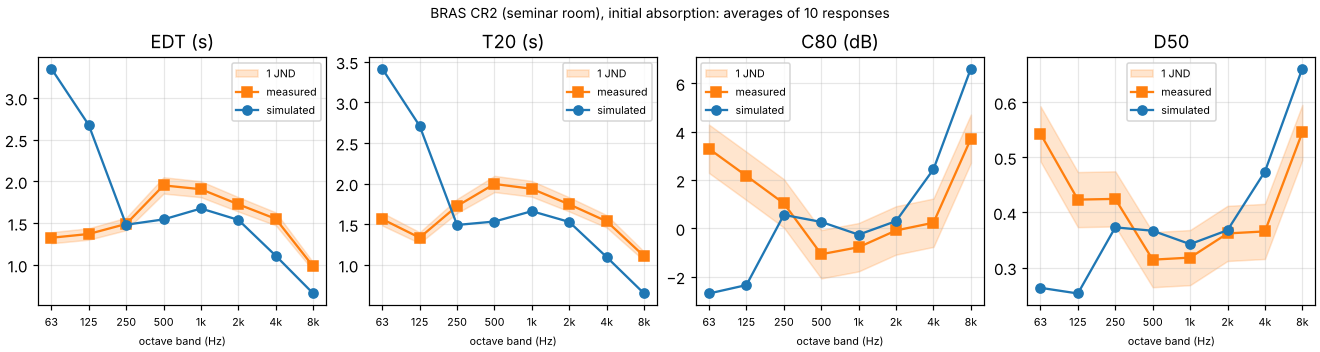
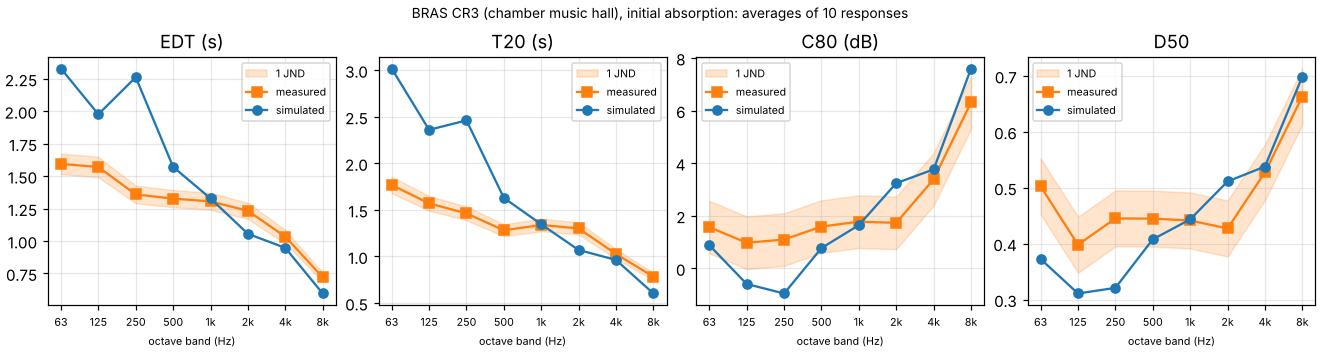
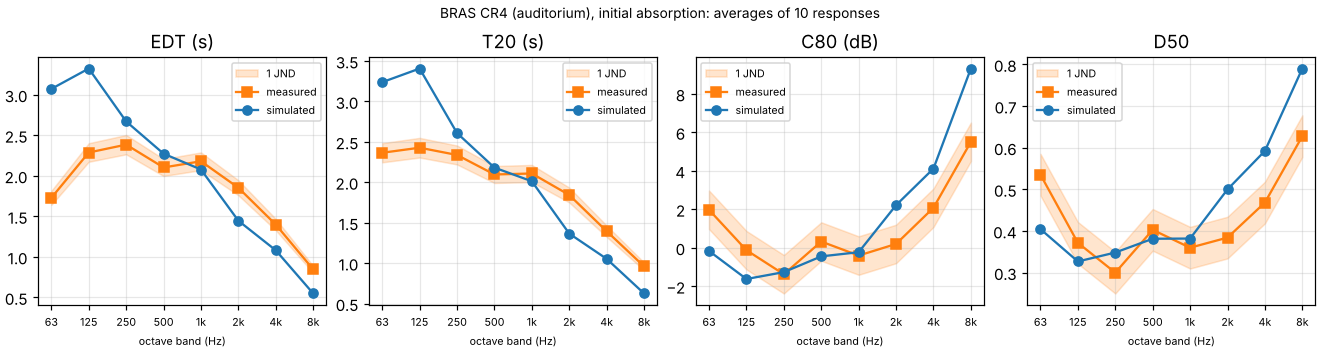
Initial absorption. With the absorption estimated before fitting, T20 at 63 and 125 Hz comes out 1.5 to 2.2 times as long as measured in the seminar room and the hall, and at 250 Hz in the hall too (2.71 s against 1.34 s in CR2 at 125 Hz), and 1.4 times in the auditorium. The initial coefficients have far less absorption there than the fitted ones. In real rooms much of it comes from structures that flex, such as panels, windows and doors, which tables of materials rarely capture. From 500 Hz to 4 kHz the seminar room’s decay is 12 to 29 % short, and at 2 and 4 kHz the hall’s is 6 to 18 % short and the auditorium’s 26 and 25 %. The simulation follows Eyring’s formula with the same coefficients within 15 % in every band of the seminar room and the hall (within 3 % from 250 Hz up in the seminar room), and is 15 to 22 % longer in every band of the auditorium, as with the fitted set, so the error is in the coefficients. This is the error to expect from tabulated coefficients alone, before a room has been measured.
Calibrated absorption. --calibrate LS1 first fits the absorption of every surface
(acoustic-spaces calibrate, see
Measurements). It fits to the T30,
EDT and C80 of the five responses of the first loudspeaker position, starting from the
initial set, with 10,000 rays per band while fitting. Then it simulates the room with
what the fit found, as above, and compares the five responses of the second position,
which the fit did not see. The table gives the mean absolute difference from 125 Hz to 4
kHz in JNDs over those five responses, with how many of their 30 pair and band values
are within one JND. The fitted and initial columns repeat the tables above, which
average all ten responses:
CR2 calibrated |
CR2 fitted |
CR2 initial |
CR3 calibrated |
CR3 fitted |
CR3 initial |
CR4 calibrated |
CR4 fitted |
CR4 initial |
|
|---|---|---|---|---|---|---|---|---|---|
EDT |
1.1 (17) |
1.0 |
5.9 |
1.4 (14) |
2.0 |
4.8 |
1.5 (12) |
3.7 |
4.0 |
T20 |
0.9 (24) |
1.0 |
6.5 |
1.0 (18) |
2.0 |
5.8 |
0.7 (24) |
3.0 |
3.7 |
T30 |
1.0 (22) |
1.0 |
6.5 |
0.5 (26) |
1.8 |
5.7 |
0.6 (25) |
3.0 |
3.8 |
C50 |
1.1 (20) |
1.0 |
1.6 |
1.2 (14) |
1.2 |
1.5 |
1.4 (13) |
1.3 |
1.6 |
C80 |
0.6 (26) |
0.7 |
1.7 |
0.8 (19) |
1.0 |
1.4 |
1.0 (16) |
1.3 |
1.5 |
D50 |
1.1 (20) |
1.0 |
1.7 |
1.3 (12) |
1.3 |
1.6 |
1.4 (14) |
1.3 |
1.7 |
Ts |
0.7 (26) |
0.8 |
3.3 |
0.8 (21) |
1.0 |
2.2 |
1.2 (14) |
2.5 |
2.8 |
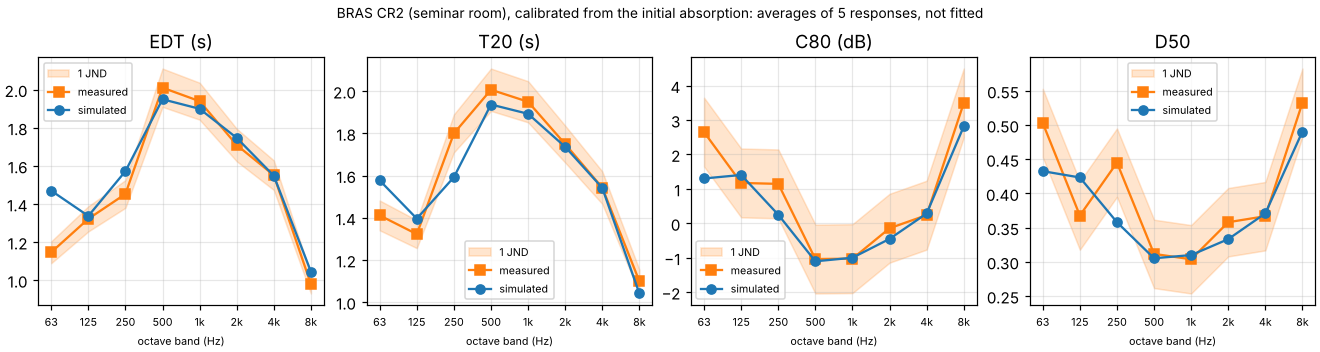
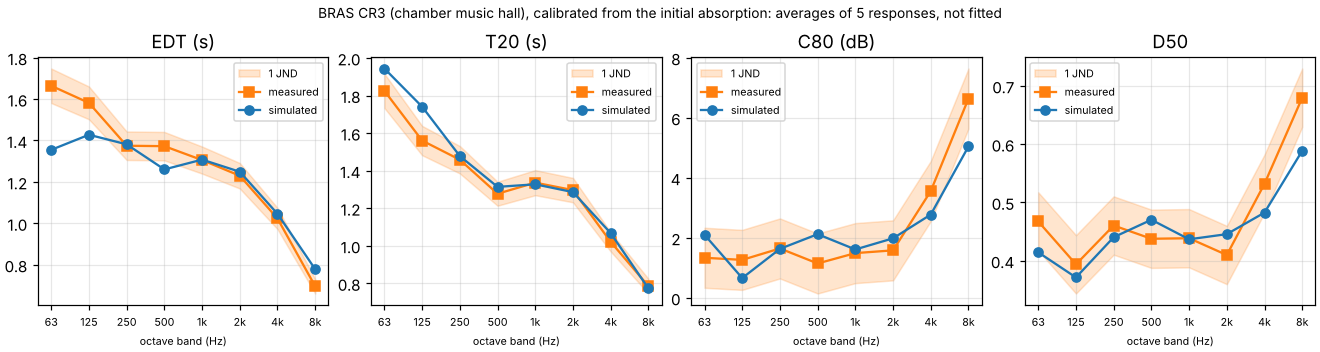
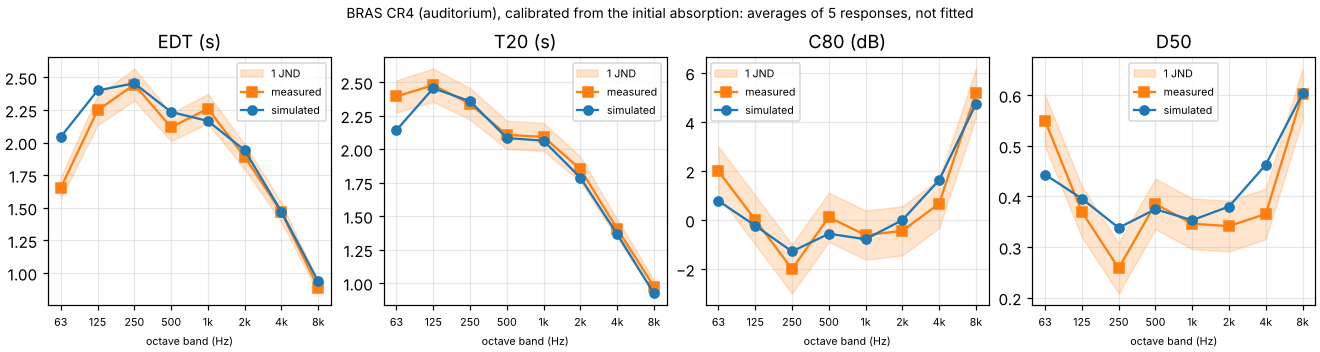
The initial estimates made the decay up to 2.2 times as long. From them, calibration brings the seminar room to about one JND on responses it did not fit, as BRAS’s fitted set does. In the hall and the auditorium it does better than the fitted set on the decay. In the hall T30 is within 0.5 JNDs on average, with 26 of the 30 values within one JND, against 1.8 with the fitted set, T20 within 1.0 against 2.0 and EDT 1.4 against 2.0. In the auditorium T20 and T30 are within 0.7 and 0.6 JNDs, with 24 and 25 of the 30 values within one JND, against 3.0 with the fitted set, and EDT 1.5 against 3.7. The fit uses the model’s own rays rather than Eyring’s formula, so it takes up what the model’s sound misses of the absorbing surfaces: from 63 Hz to 4 kHz it found 3 to 23 % more absorption in all than BRAS’s fitted set in the hall, and 18 to 30 % more in the auditorium. The clarity stays within 0.8 to 1.4 JNDs on average, as with the fitted set (1.0 to 1.3).
In the seminar room the fit found nearly BRAS’s fitted set, though it started from the initial one. The windows absorb 0.24 and 0.31 at 63 and 125 Hz (BRAS fitted 0.25 and 0.19, initial 0.13 and 0.10), and every other value is within 0.022 of BRAS’s. In the hall it found more absorption than BRAS in the plaster at 125 and 250 Hz (0.22 and 0.20 against 0.11 and 0.15) and in the seating at 63 Hz and 2 kHz (0.29 and 0.58 against 0.17 and 0.41), and less in the seating at 125 and 250 Hz (0.13 and 0.23 against 0.21 and 0.37) and in the structured plaster at 2 kHz (0.10 against 0.14). In the auditorium the linoleum absorbs 0.23 and 0.28 at 63 and 125 Hz (BRAS fitted 0.15 and 0.10), the brick wall 0.31 at 500 Hz (0.20) and the wood panels 0.27 at 4 kHz (0.12).
These are what a model needs to match the room, not what each surface absorbs. With one loudspeaker position and five microphones, the uncertainty the fit reports is above 0.2 for most materials and bands in the hall and the auditorium, and 0.49 or more for all of them in the seminar room. The measurements fix each band’s total absorption, and the proportions between materials come from the initial estimates. Telling surfaces apart takes responses that hear them differently, such as sources and microphones near different surfaces.
Some differences remain:
250 Hz in the seminar room. T30 is 3.1 JNDs short on the second loudspeaker’s responses, though 1.2 off on average on the first’s. The two positions measured 1.70 and 1.90 s on average. This is near the room’s Schroeder frequency, about 230 Hz, where a decay depends on where it is measured.
8 kHz in the seminar room. The decay stays 2 JNDs short even with surfaces that absorb next to nothing, because in octave bands the air absorbs at the octave’s centre frequency (see “Third-octave bands” above).
63 Hz in the seminar room. EDT stays 5.9 JNDs long. This is below the room’s Schroeder frequency, where a geometric model gives an average rather than the room’s modes: a likely cause, not traced.
63 and 125 Hz in the hall. EDT is 3.7 and 1.6 JNDs short and T20 1.7 and 2.4 JNDs long. At 63 Hz the early part is stronger than measured, as with the fitted set (see “The hall’s early part at low frequencies” above). The hall’s Schroeder frequency is about 45 Hz.
63 Hz in the auditorium. EDT is 5.1 JNDs long and T30 3.4 JNDs short.
Fitting took 5.3 minutes for the seminar room (three rounds of tracing at the first position’s 10,000 rays per band), 4.4 minutes for the auditorium (four rounds) and 3.7 hours for the hall (four rounds), where nearly all of it is the early stage’s edge diffraction, which fewer rays do not shorten. Simulating again took about 4 minutes in the seminar room and the auditorium and 89 minutes in the hall.
Coupled rooms
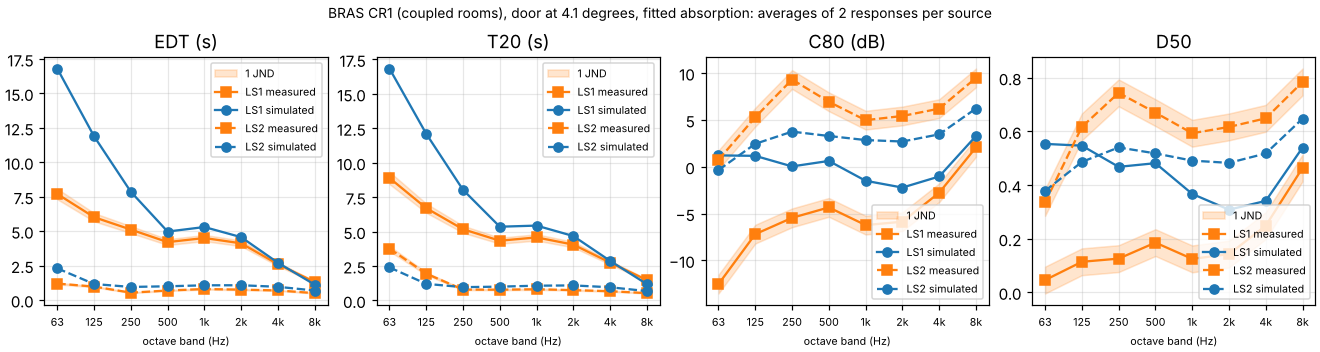
In CR1 the door, open by 4.1°, leaves the rooms joined by a slit: about 4 cm between the leaf’s free end and the jamb, over the door’s height, and a wedge above the leaf, about 0.1 m² in all. In the model, nothing else joins them. The scene’s absorption is BRAS’s fitted set, fitted to each room on its own, so the chamber alone decays in 12.4 s at 125 Hz and 5.5 s at 500 Hz by Eyring’s formula, and the laboratory in 1.0 and 0.7 s (with each room’s volume and surface as BRAS’s material file gives them).
LS1’s sound reaches the microphones in the laboratory from the chamber. Simulated, it
decays in 12.1 s at 125 Hz and 5.4 s at 500 Hz (T20), within 5.3 % of what the diffuse
theory of two coupled rooms gives from 125 Hz to 2 kHz with those Eyring times and an
opening of 0.1 m² (11.7 and 5.4 s; validation/coupled_rooms.py). Near that opening
the decay changes little with it, so the simulated decays correspond to openings from
0.04 to 0.33 m² in the same theory. The measured sound decays in 6.7 and 4.3 s: in
the theory the rooms would need to be joined by 1.5 and 1.6 m² at 125 and 250 Hz and
1.0 m² from 500 Hz to 2 kHz, 10 to 16 times the model’s opening. The model’s door
is a rigid slab, without the transmission BRAS gives no data for, and its rooms meet
nowhere else, so what joins the real rooms that strongly is not in the model. LS1’s EDT
and T20 are 2 to 25 JNDs long from 63 Hz to 2 kHz, and C80 4 to 14 dB high.
LS2’s sound decays in the laboratory, where the measured decays bend: their EDT is 0.80 s at 1 kHz and their T30 1.41 s, at 125 Hz 0.97 and 4.38 s, the chamber’s sound coming back through the door. The simulated decays are single slopes, so T30 is 5 to 14 JNDs short from 125 Hz to 1 kHz. Their EDT is 1.1 s at 1 kHz, a third longer than the 0.8 s Eyring’s formula gives for the laboratory with the fitted set, which is what was measured: as in the hall and the auditorium, the model decays more slowly than Eyring’s diffuse field with the same absorption, here more so.
With the door at 4.1° and calibrated on LS1’s responses from the initial set
(--calibrate LS1), the fit raised the absorption of the chamber’s painted concrete to
4.5 times BRAS’s fitted value at 125 Hz and 1.2 to 1.7 times from 250 Hz to 4 kHz, which
brings LS1’s EDT within 16 % and its T20 within 11 % from 125 Hz to 4 kHz, and took the
laboratory’s absorber down from 0.49 to 0.20 at 1 kHz, as LS1’s responses do not pin it
(the fit reports an uncertainty of 0.33 to 6.7 for it). LS2’s responses, which the fit
did not see, then decay in 2.2 s at 1 kHz against 0.8 s measured, 55 JNDs off in EDT on
average. A calibration fits the responses it is given; in coupled rooms each room needs
responses of its own.
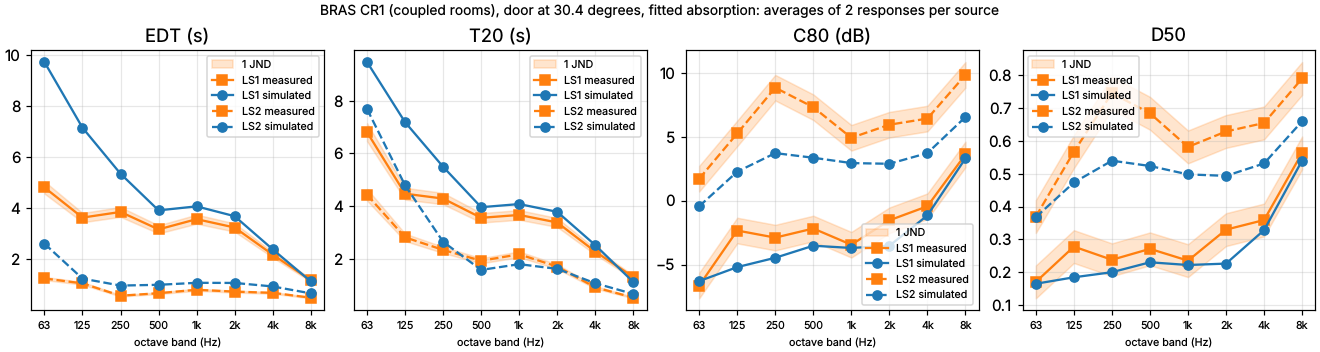
With the door open by 30.4°, the leaf stands in the chamber beside the doorway. LS1’s sound crosses the doorway (2.9 m² beside the box on the leaf) and then goes round the leaf (about 2.0 m², between the box and the doorway’s far side and over the leaf), and in the same theory two openings crossed in turn, with no absorption between them, act as one of 1.2 m². Simulated, the sound decays in 7.2 s at 125 Hz and 4.0 s at 500 Hz, 1.5 to 7.3 % faster than the theory with that opening from 125 Hz to 2 kHz (7.3 and 4.2 s): the simulated decays correspond to openings of 1.2 to 1.6 m². The measured sound decays in 4.5 and 3.6 s, so the decay comes much closer than with the door at 4.1°: T20 is 11 to 12 % long from 500 Hz to 4 kHz (2.1 to 2.4 JNDs), against 5 to 24 %, and 60 and 28 % long at 125 and 250 Hz, against 81 and 55 %; C80 is 0.3 to 2.9 dB low from 125 Hz to 4 kHz. In the theory the measured decays need openings of 2.2 to 2.5 m² from 250 Hz to 2 kHz, 0.7 to 1.2 m² more than the simulated ones, and with the door at 4.1° 0.7 to 1.5 m² more: what the model lacks changes little with the door’s angle. At 125 Hz they need 3.6 m², more than the whole doorway (3.2 m²).
LS2’s measured decays bend more than with the door at 4.1° (EDT 0.80 s and T30 3.17 s at 1 kHz), and the simulated ones bend too: T30 is within 1.6 JNDs from 500 Hz to 4 kHz, though 31 and 78 % long at 250 and 125 Hz. EDT is 1.08 s at 1 kHz, as with the door at 4.1°. G from seat to seat, which holds the level of LS1’s sound in the laboratory against LS2’s, is within 1 dB in 20 of the 24 values (5 with the door at 4.1°).
The CR1 runs take 2 minutes and 0.7 GiB with the door at either angle (5 minutes and 0.9 GiB in third-octave bands, 4 minutes calibrated, with the door at 4.1°).
Strength (G)
The measured responses are in pascals. BRAS calibrated the measuring chain to 80 dB at 2 m in front of the dodecahedron at 1 kHz, and corrected each room’s level by 6 dB by hand to meet the expected direct sound. Read with the dodecahedron’s directivity (BRAS’s data, averaged over all directions) and 80 dB as the level of the 1 kHz sine, the measured G is 2.3 to 3.3 dB above classic diffuse theory (10 log10(100/r² + 31,200 T30/V), with the measured T30) at 500 Hz, 1 kHz and 4 kHz in the seminar room and the hall, and 1.7 to 2.4 dB in the auditorium, and the direct sound is about 2 to 3 dB above the calibration even in the dodecahedron’s loudest direction, in the hall’s pairs where it stands apart. At 2 kHz it is within 0.6 dB of the theory, about 3 dB below the neighbouring octaves in all three rooms, which the dodecahedron’s directivity data do not explain. The simulated G is within 1.3 dB of the same theory there (0.0 in the seminar room). Read with 80 dB as the sine’s peak instead, which lowers the measured G by 3 dB, it comes within 1.3 dB of the theory at 500 Hz, 1 and 4 kHz in all three rooms, and 2.4 to 3.5 dB below it at 2 kHz. Which reading BRAS meant is not stated, so an absolute G against these responses would test the reading, not the simulation. These absolute levels come from one-off checks with BRAS’s dodecahedron data and measured responses, and the simulated ones from the fitted runs, which the fixes at 125 Hz leave as they were from 250 Hz up; no script in the repository makes them yet.
Simulated minus measured G with the first reading, at 500 Hz, 1, 2 and 4 kHz (means over the pairs, standard deviations 0.2 to 0.9 dB):
500 Hz |
1 kHz |
2 kHz |
4 kHz |
|
|---|---|---|---|---|
CR2 |
-2.3 |
-3.1 |
+0.2 |
-2.9 |
CR3 |
-1.3 |
-2.1 |
+0.1 |
-3.2 |
CR4 |
-1.7 |
-2.1 |
+0.5 |
-2.2 |
These are left out of the JND counts. What is compared is G from seat to seat: each pair’s simulated G less the mean over the room’s pairs, against each pair’s measured level less its mean, which the level’s reference does not touch. From 125 Hz to 4 kHz it is within one JND (1 dB) in 53 of the 60 values in the seminar room, 52 in the hall and 50 in the auditorium, 0.3 to 0.6 dB off on average. In the coupled rooms, where it holds the level of the chamber’s sound against the laboratory’s own, it is 1.8 dB off with the door at 4.1°, 5 of 24 within 1 dB: the coupling again; with the door at 30.4°, 0.6 dB off, 20 of 24.
Interaural cross-correlation
BRAS also measured binaural responses in the seminar room, the hall and the auditorium:
five QSC K8 loudspeakers (LS3 to LS7), one at a time, aimed at FABIAN, a head and torso
simulator 4 to 5 m away in the seminar room and 10 to 11 m in the hall and the
auditorium, facing LS7 with its head straight. validation/bras_binaural.py simulates
each loudspeaker with the K8’s measured directivity (validation/bras/QSC_K8.csv) and
the fitted absorption, renders the response through FABIAN’s head-related impulse
responses (every 2°), and compares IACC_E (the first 80 ms) and IACC_L (from 80 ms) with
those of the measured responses, analysed by this package, in JNDs of 0.075 (ISO
3382-1). The late part of a rendered response is noise drawn anew with each seed, and so
are the phases of paths over edges that arrive together, so the simulated values are
means over 10 seeds. From 125 Hz to 4 kHz their standard deviation, averaged over a
room’s loudspeakers, is 0.10 at most, and 0.14 for one loudspeaker.
Means over the five loudspeakers, measured / simulated, and how many of the 30
loudspeaker and band values from 125 Hz to 4 kHz are within one JND:
IACC_E |
125 Hz |
250 Hz |
500 Hz |
1 kHz |
2 kHz |
4 kHz |
within 1 JND |
mean (JNDs) |
|---|---|---|---|---|---|---|---|---|
CR2 |
0.90 / 0.91 |
0.66 / 0.74 |
0.38 / 0.32 |
0.37 / 0.32 |
0.42 / 0.37 |
0.36 / 0.31 |
18 |
1.1 |
CR3 |
0.94 / 0.93 |
0.79 / 0.71 |
0.48 / 0.31 |
0.48 / 0.40 |
0.65 / 0.53 |
0.55 / 0.52 |
19 |
1.2 |
CR4 |
0.96 / 0.96 |
0.87 / 0.85 |
0.86 / 0.81 |
0.81 / 0.83 |
0.87 / 0.87 |
0.87 / 0.87 |
25 |
0.5 |
IACC_L |
125 Hz |
250 Hz |
500 Hz |
1 kHz |
2 kHz |
4 kHz |
within 1 JND |
mean (JNDs) |
|---|---|---|---|---|---|---|---|---|
CR2 |
0.90 / 0.89 |
0.54 / 0.67 |
0.14 / 0.18 |
0.11 / 0.09 |
0.07 / 0.08 |
0.06 / 0.07 |
25 |
0.6 |
CR3 |
0.95 / 0.91 |
0.73 / 0.71 |
0.20 / 0.17 |
0.14 / 0.12 |
0.11 / 0.09 |
0.10 / 0.10 |
26 |
0.6 |
CR4 |
0.92 / 0.92 |
0.72 / 0.74 |
0.33 / 0.27 |
0.34 / 0.20 |
0.29 / 0.25 |
0.26 / 0.15 |
19 |
1.2 |
IACC_L is within one JND in 19 to 26 of the 30 values; in the auditorium it is 2.0 and
1.4 JNDs low at 1 and 4 kHz, which is not traced. IACC_E is within one JND in 25 in the
auditorium, and in the seminar room within about one JND on average in every band, but
1.0 to 2.2 JNDs low in the hall from 500 Hz to 2 kHz. Split into the direct sound (its
first 5 ms) and the rest of the first 80 ms, and the simulated responses also into their
direct sound, specular reflections, diffracted paths and late part, rendered one at a
time (one seed of the rendering, validation/bras_iacc_parts.py):
The hall from 500 Hz to 2 kHz. From LS7 the simulated sound after the first 5 ms is about as strong against the direct sound as measured (3.0 dB above it at 1 kHz in both, 4.3 and 0.6 dB against 5.8 and 1.3 dB at 500 Hz and 2 kHz), but far less alike at the two ears: its IACC is 0.18 at 1 kHz against 0.63 measured, and 0.35 against 0.73 at 500 Hz. At 1 kHz the direct sound, the specular reflections, the diffracted paths and the late part each carry a quarter to a third of the early sound, and the diffracted paths and the late part are the least alike at the ears (0.25 and 0.21). Why the simulated early sound is less alike at the ears than the measured is not traced.
The auditorium at 500 Hz. The simulated sound in the 75 ms after the direct sound is 4.4 and 6.7 dB stronger against the direct sound than measured (LS4 and LS5), and within 1.2 dB from 1 to 4 kHz. At 500 Hz the specular reflections alone, over the first 80 ms, are 1.3 dB below the direct sound from both loudspeakers, where all of the measured sound after the direct sound is 5.9 and 6.3 dB below it. IACC_E there is within one JND on average all the same (0.81 against 0.86); those reflections reach the two ears nearly alike (0.89 and 0.90).
How much a run varies
The late rays are traced in 10 batches by default, which gives each simulated parameter
a standard error: one standard deviation of how much it would change between runs with
other seeds (see Simulation, late reverberation). bras_validation.py
prints the largest over each room’s pairs from 125 Hz to 4 kHz, in JNDs. With the fitted
absorption, at 50,000 rays per band:
largest standard error (JNDs) |
CR1, 4.1° |
CR1, 30.4° |
CR2 |
CR3 |
CR4 |
|---|---|---|---|---|---|
EDT |
1.08 |
0.24 |
0.12 |
0.56 |
0.48 |
T20 |
0.42 |
0.28 |
0.07 |
0.34 |
0.36 |
T30 |
0.22 |
0.23 |
0.05 |
0.25 |
0.20 |
C50 |
0.46 |
0.15 |
0.06 |
0.23 |
0.15 |
C80 |
0.57 |
0.14 |
0.05 |
0.22 |
0.20 |
D50 |
0.52 |
0.11 |
0.06 |
0.25 |
0.17 |
Ts |
0.88 |
0.28 |
0.06 |
0.14 |
0.20 |
In the seminar room no standard error is above an eighth of a JND. In the hall and the auditorium EDT’s standard error is a third of a JND for a typical pair and band (the median, 0.33 and 0.28) and half a JND at most, so there a difference from the measurement below one JND is partly the run’s own; decays 2 to 4 JNDs long are not. In the coupled rooms with the door at 4.1° the largest are those of LS1’s sound, which reaches the laboratory through the slit by the door: EDT 1.08 JNDs at 4 kHz; with the door at 30.4° none is above 0.28 JNDs. With the initial absorption the hall’s largest is T30’s, 0.92 JNDs at one pair at 4 kHz.
Edge diffraction against the exact solution
validation/edge_diffraction.py compares the engine’s edge diffraction with the
Biot-Tolstoy-Medwin (BTM) solution for rigid wedges (Svensson, Fred and Vanderkooy,
1999), which writes the diffracted sound as an integral along the edge: first order
over one edge, second order over two in turn, with half the integral when the two edges
share a face. The script integrates both along edges 80 m long, densest where the
shortest path touches them, and checks itself against the UTD for a half-plane, which
is exact far from the edge (within 0.03 dB). Levels are in dB re the direct sound in
free field over the same distance, the energy averaged over the engine’s eight
frequencies in each octave band; sources and listeners are in metres from the edge.
Over a thin screen (first order), with the listener 28° to 33° into its shadow, the engine’s UTD is within 0.9 dB of BTM at 63 Hz and 0.06 dB from 1 kHz up; Maekawa’s chart reads up to 1.2 dB high:
thin screen, engine - BTM (dB) |
63 |
125 |
250 |
500 |
1000 |
2000 |
4000 |
8000 |
|---|---|---|---|---|---|---|---|---|
(-5, 0, -2) to (5, 0, -1), BTM -8.4 to -27.2 dB |
-0.50 |
-0.27 |
-0.13 |
-0.05 |
-0.02 |
-0.00 |
-0.00 |
+0.00 |
(-2, 0, -0.2) to (6, 0, -3), BTM -6.9 to -24.6 dB |
-0.77 |
-0.46 |
-0.24 |
-0.11 |
-0.04 |
-0.01 |
-0.00 |
-0.00 |
(-3, -1, -1) to (3, 2, -0.5), BTM -6.3 to -23.2 dB |
-0.89 |
-0.56 |
-0.32 |
-0.16 |
-0.06 |
-0.02 |
-0.01 |
-0.00 |
Over two edges (second_order): a block of width w with its top at z = 0, from
x = 0 to w, and two thin screens in a row. Each pair of positions is in line across the
edges and obliquely (the second from (-6, -2, -0.3) to (w + 2, 3, -4)):
over two edges, engine - BTM (dB) |
63 |
125 |
250 |
500 |
1000 |
2000 |
4000 |
8000 |
|---|---|---|---|---|---|---|---|---|
block 0.3 m, (-3, 0, -1) to (3.3, 0, -1.5) |
-1.72 |
-1.26 |
-0.67 |
-0.15 |
+0.19 |
+0.29 |
+0.23 |
+0.13 |
block 0.3 m, oblique |
-0.65 |
-0.31 |
-0.19 |
-0.16 |
-0.14 |
-0.10 |
-0.07 |
-0.08 |
block 1 m, (-3, 0, -1) to (4, 0, -1.5) |
-0.56 |
-0.28 |
-0.04 |
+0.12 |
+0.16 |
+0.12 |
+0.06 |
+0.03 |
block 1 m, oblique |
-0.38 |
-0.28 |
-0.19 |
-0.13 |
-0.08 |
-0.06 |
-0.05 |
-0.03 |
block 3 m, (-3, 0, -1) to (6, 0, -1.5) |
-0.21 |
-0.07 |
+0.01 |
+0.05 |
+0.04 |
+0.02 |
+0.01 |
+0.00 |
block 3 m, oblique |
-0.28 |
-0.20 |
-0.13 |
-0.09 |
-0.06 |
-0.04 |
-0.02 |
-0.03 |
two screens 1 m apart |
-1.86 |
-1.23 |
-0.74 |
-0.37 |
-0.12 |
-0.00 |
+0.01 |
+0.01 |
two screens 2 m apart, the second 0.4 m higher |
-1.30 |
-0.92 |
-0.65 |
-0.44 |
-0.30 |
-0.18 |
-0.11 |
-0.05 |
With the block’s faces absorbing 0.02 the engine’s level is below its own for the rigid block by the loss of the Weyl-van der Pol ground wave along the top, the magnitude of F(w) worked out by hand (0.01 dB at 63 Hz over 0.3 m to 0.43 dB at 8 kHz over 3 m), within 0.03 dB in every band, in energy and in pressure. Against BTM for the rigid block it is then within 1.74 dB, and within 0.64 dB at 63 and 125 Hz in pressure.
The levels themselves run from -9 dB at 63 Hz to -42 dB at 8 kHz. Adding its waves in
energy, the engine is low: up to 1.9 dB at 63 Hz where the edges are close together, as
over a thin screen, and near a shadow boundary in every band. The waves of an edge add
in energy near their boundaries, where the exact solution adds them with their phases.
At a shadow boundary the source is at (-5, 0, -2) and the listener at (5, 0, 1.999), 1
mm into the shadow of a thin screen, of a right-angled corner (the block above, 300 m
wide) or of a wedge open over 225° (the same block with its front face sloping down at
45° towards the source), or at (5, 0, 1), 10.5° into it; the whole early stage
(early_paths with the default settings but coherent_max_band_hz: null, so that every
band adds in energy, and the air’s absorption over the direct distance taken off)
against BTM averaged over 96 frequencies in each band:
at a shadow boundary, engine in energy - BTM (dB) |
63 |
125 |
250 |
500 |
1000 |
2000 |
4000 |
8000 |
|---|---|---|---|---|---|---|---|---|
thin screen, on the boundary, BTM -4.5 to -5.9 dB |
-1.29 |
-0.95 |
-0.69 |
-0.50 |
-0.36 |
-0.25 |
-0.18 |
-0.13 |
thin screen, 10.5° into the shadow, BTM -5.7 to -18.5 dB |
-0.99 |
-0.68 |
-0.45 |
-0.28 |
-0.15 |
-0.08 |
-0.03 |
-0.02 |
right-angled corner, on the boundary, BTM -1.8 to -5.6 dB |
-2.54 |
-2.15 |
-1.73 |
-1.32 |
-0.98 |
-0.72 |
-0.52 |
-0.38 |
right-angled corner, 10.5° into the shadow, BTM -2.1 to -16.3 dB |
-1.96 |
-1.50 |
-1.05 |
-0.66 |
-0.37 |
-0.18 |
-0.07 |
-0.03 |
wedge open over 225°, on the boundary, BTM 0.3 to -5.3 dB |
-3.02 |
-2.65 |
-2.22 |
-1.79 |
-1.38 |
-1.04 |
-0.77 |
-0.56 |
wedge open over 225°, 10.5° into the shadow, BTM 0.0 to -15.2 dB |
-2.13 |
-1.61 |
-1.12 |
-0.71 |
-0.40 |
-0.19 |
-0.08 |
-0.03 |
On the boundary the term of the incident wave continues the direct sound almost wholly,
and the terms of the reflections off the edge’s faces, which arrive with it, are part of
the edge’s diffracted wave: the two waves add in energy, and their cross term is lost.
Indoors the paths add in energy from 250 Hz up by default, so there the level on the
shadow boundary of a right-angled corner is 1.73 dB low at 250 Hz, 0.98 dB at 1 kHz and
0.38 dB at 8 kHz; behind the blunter wedge open over 225° it is 2.22, 1.38 and 0.56 dB
low, and behind the thin screen 0.69, 0.36 and 0.13 dB (see Known
issues). In the 63 and 125 Hz bands the engine adds them in pressure by
default (simulation.early.coherent_max_band_hz, see
Simulation), the four
terms of each coefficient and the paths’ waves with their phases, and there it is within
0.05 dB of BTM over the thin screen, 0.08 dB at the shadow boundaries and 0.25 dB over
two edges, but for the 0.3 m block in line (0.6 dB):
engine in pressure - BTM (dB) |
63 |
125 |
|---|---|---|
thin screen, (-5, 0, -2) to (5, 0, -1) |
+0.02 |
+0.01 |
thin screen, (-2, 0, -0.2) to (6, 0, -3) |
+0.03 |
+0.01 |
thin screen, (-3, -1, -1) to (3, 2, -0.5) |
+0.04 |
+0.02 |
thin screen, on the shadow boundary ( |
-0.01 |
-0.01 |
thin screen, 10.5° into the shadow ( |
+0.02 |
+0.01 |
right-angled corner, on the shadow boundary ( |
-0.00 |
-0.01 |
right-angled corner, 10.5° into the shadow ( |
+0.06 |
+0.03 |
wedge open over 225°, on the shadow boundary ( |
+0.02 |
-0.01 |
wedge open over 225°, 10.5° into the shadow ( |
+0.08 |
+0.03 |
block 0.3 m, in line |
-0.61 |
-0.50 |
block 0.3 m, oblique |
+0.12 |
+0.24 |
block 1 m, in line |
+0.11 |
+0.11 |
block 1 m, oblique |
+0.13 |
+0.06 |
block 3 m, in line |
+0.22 |
+0.16 |
block 3 m, oblique |
+0.08 |
+0.04 |
two screens 1 m apart |
-0.11 |
-0.13 |
two screens 2 m apart, the second 0.4 m higher |
+0.03 |
-0.01 |
The textbook UTD for two edges, with the second edge’s distance parameter for a wave from a line, was up to 6 dB low there; the engine takes it from the curvature of the first edge’s wave where it reaches the second.
Along a top absorbing 0.2 to 0.8, the ground wave’s loss is too large against the full wave. The wave solver ran a block 24 m long and 12 m deep whose top alone absorbs (5 cm cells, the first 50 ms, and a probe 3 m above the top that widened the grid, as with the grid ending a few cells above the top its matched layer had put the rigid level 0.5 to 0.6 dB high at 125 Hz), the source and the listener 1 m below the plane of the top and 3 m off its edges, and over the 1 m top absorbing 0.5 also 2 and 4 m off them with the listener 0.5 m below. Over tops 1 and 3 m wide absorbing 0.2, 0.5 and 0.8 it puts the level at 63 and 125 Hz 0.04 to 2.0 dB below the rigid block’s, and the engine is 0.22 to 3.1 dB below that, more as the top absorbs more and is wider (0.22 to 0.38 dB at 0.2, 1.8 to 3.1 dB at 0.8); before these paths took the ground wave it was 9.3 to 15.7 dB below. The wave solver there is within 0.09 dB of BTM over the rigid blocks and within 0.07 dB of the exact solution over a plane absorbing 0.2 to 0.8 (with the engine’s fitted admittance, source and listener 0.1 m high and 7 m apart), and with 6.2 cm cells the level over the 3 m top absorbing 0.8 moves by 0.03 and 0.04 dB (all of these with the wave solver’s trilinear reading; its cubic one moves the rigid 3 m block’s level by 0.01 and 0.03 dB).
As the source rises through the plane of the 1 m block’s top, 3 m in front of it, it
comes into sight of the far corner, and the path over that corner alone takes over
from the path over both; likewise as the listener rises behind the block. The largest
step between positions 1 mm apart, over ±1 cm and exactly in the plane, is 0.62 dB for
the source and 0.72 dB for the listener at 63 Hz with the waves added in energy, 0.01 dB
with them in pressure (the default in that band), and at most 0.07 dB from 1 kHz up.
With first_order the level drops from the path over one corner to nothing.
Just over the top, with the source and the listener both a little above its plane and
in sight of each other, the source’s wave passes both corners. Each corner’s terms take
their part off the direct sound and off its reflection off the top, and the path over
both gives back what they take twice: at grazing incidence the direct sound, the
reflection and the two corners’ terms come to nothing, and the path over both is all
there is, half the direct sound at high frequencies. The whole early stage
(early_paths, with the paths in pressure up to 500 Hz and the air’s absorption over
the direct distance taken off) against BTM with the geometric waves, over a block 10 m
wide with the source 10 m before it and the listener 5 m past it, and over the 1 m
block with both 3 m off, by their heights above the plane of the top:
just over a block’s top, engine - BTM (dB) |
63 |
125 |
250 |
500 |
|---|---|---|---|---|
10 m, both 1 cm above, BTM -5.2 to -5.6 dB: |
-0.02 |
-0.03 |
-0.04 |
-0.05 |
|
-12.63 |
-15.33 |
-18.10 |
-20.66 |
10 m, both 0.5 m above, BTM -3.6 to -1.1 dB: |
-0.02 |
+0.01 |
+0.03 |
+0.04 |
|
-6.45 |
-4.57 |
-2.58 |
-0.90 |
10 m, 0.5 and 0.05 m above, BTM -4.5 to -3.7 dB: |
-0.06 |
-0.04 |
-0.02 |
-0.00 |
|
-10.33 |
-9.54 |
-7.59 |
-5.31 |
10 m, both 1 m above, BTM -2.1 to 2.5 dB: |
+0.02 |
+0.04 |
+0.03 |
+0.01 |
|
-2.65 |
-1.02 |
+0.18 |
+0.72 |
10 m, both 2 m above, BTM -1.8 to 3.5 dB: |
+0.05 |
+0.03 |
+0.01 |
+0.02 |
|
+0.06 |
+0.65 |
+0.52 |
-0.08 |
1 m, both 5 cm above, BTM -4.4 to -4.9 dB: |
-1.17 |
-0.72 |
-0.75 |
-0.62 |
|
-9.01 |
-11.05 |
-12.59 |
-12.59 |
1 m, both 0.3 m above, BTM -3.4 to -1.9 dB: |
-0.67 |
-0.13 |
-0.03 |
+0.10 |
|
-6.51 |
-5.55 |
-3.76 |
-1.89 |
With second_order the engine is within 0.06 dB of BTM over the 10 m top, and within
1.2 dB over the 1 m top, whose corners are 0.18 wavelengths apart at 63 Hz. A
centimetre above the 10 m top it is at -5.84 to -5.91 dB from 1 kHz up, 0.22 to 0.28 dB
below BTM, where half the direct sound is -6.02 dB. first_order has no path over two
edges and is low by what that path carries (see Known issues). From
1 kHz up the scene adds the direct sound and its reflection off the top in energy,
which BTM adds with their phases: half a metre and more above the top the two then
differ by up to 4.5 dB in a band, with either setting. Swapping the source and the
listener leaves every level of the table as it is. Within a millimetre of the plane,
above it or below on either side of the 10 m block, the level is the same within
0.11 dB in every band; with the source or the listener exactly in the plane it differs
by up to 0.8 dB at 63 Hz and 0.29 dB at 500 Hz, and no more from 1 kHz up (at a gable
roof’s slope by 1.5 dB at 63 Hz, in a one-off check). Over the 1 m
top it differs by up to 1.7 dB at 63 Hz and 0.8 dB from 1 kHz up between those
positions. With a top absorbing 0.5, the level 1 mm and 1 cm above the plane of the 1 m
top is below the rigid top’s by the ground wave’s loss over the top (0.9 dB at 63 Hz to
9.3 dB at 8 kHz) within 0.5 dB, as it is just below the plane within 0.12 dB
(tests/test_diffraction.py).
Behind the block, with the source still above the plane of its top, the source’s wave passes the near corner on its way to the far one, round which the listener hears it: the near corner’s terms take their part off it, and the path over both carries that. Over the 10 m block, the source 10 m before it and the listener 5 m past it:
behind a 10 m block, engine - BTM (dB) |
63 |
125 |
250 |
500 |
|---|---|---|---|---|
source 1 cm above, listener 0.5 m below, BTM -6.2 to -8.6 dB: |
+0.06 |
+0.09 |
+0.08 |
+0.04 |
|
+5.67 |
+5.81 |
+5.87 |
+5.88 |
1 cm above, 5 m below, BTM -12.2 to -21.5 dB: |
-0.43 |
+0.03 |
+0.25 |
+0.19 |
|
+5.17 |
+5.75 |
+6.05 |
+6.03 |
0.5 m above, 2 m below, BTM -8.2 to -13.5 dB: |
+0.02 |
-0.01 |
-0.02 |
-0.03 |
|
+5.09 |
+4.93 |
+4.65 |
+4.23 |
2 m above, 2 m below, BTM -6.4 to -9.0 dB: |
-0.01 |
-0.02 |
-0.02 |
-0.00 |
|
+3.38 |
+2.55 |
+1.43 |
+0.10 |
first_order has the path over the far corner as if the near one were not there, up to
6 dB too high (see Known issues).
Two thin screens in a row with their tops on one line, 10 m apart, the source 10 m
before the first and the listener 5 m past the second: the Fresnel-Kirchhoff integral
over both half-planes (Millington, Hewitt and Immirzi, 1962) leaves, at grazing
incidence and high frequencies, 1/4 + atan(√(a c / (b (a + b + c)))) / (2π) of the free
field for the distances a, b and c along the way: a third for equal ones, where one
edge alone leaves a half and two far apart a quarter, and -9.98 dB here. A wave bent at
the first edge and again, as a wave of its own, at the second does not hold there, as
the second edge stands in the transition zone of the first: BTM’s second order and the
product of two UTD coefficients both leave about a quarter, -12 dB. With the source and
the listener 1 mm above the line of the tops the engine (second_order, the whole
early stage) is at -10.97 to -11.29 dB from 2 kHz up, 1.0 to 1.3 dB low; 1 mm below
it, where the path over both is all there is, at -12.08 to -12.11 dB, 2.1 dB low (see
Known issues). first_order is at -30.5 to -36.2 dB above the line
and has nothing below it.
With both exactly on the line no ray finds the direct sound, while the rays that look
for the paths over the tops, which start just off the edges, find those, and each
top’s path alone would stand for all of the direct sound. The engine takes the level
there to be the one just above the line: every top on the way takes its term off the
direct sound, as on the lit side of its boundary, by the share its edge gives where
the way passes near its end or beside it, and one top’s path carries the direct sound.
The level is that 1 mm above the line within 0.1 dB in every band, and within 0.15 dB
where one of the two screens ends a centimetre beside the way, where both end 10 and
15 cm beside it, and where the way passes through the end of a screen at 45 degrees to
it (tests/test_diffraction.py; higher above the end of an oblique screen it is not,
see Known issues). A reflection that passes level with the tops is
taken the same way where both tops stand on one leg of it. With a wall beside two
screens, where the reflection off the wall lies between the tops, the terms that make
reflections fade at edges take the product of the two tops’ terms for it, the level
just below the line: the whole level is that 1 mm above the line within 0.1 dB (it was
9.3 to 11.3 dB above that). first_order has no path over a top and the upright
end of the next screen, which holds the terms of that end’s faces on the line: where
a screen ends near the way it is up to 1.2 dB below its level 1 mm above the line at
63 Hz. With one of the two on the line and the other 0.5 m above it, the level is that
with it 1 mm above the line, and 0.5 dB (the source) or 1.0 dB (the listener) above
that with it 1 mm below at 63 Hz, 0.1 dB (the source) or 0.3 dB (the listener) at
2 kHz.
More edges in a row, the source 10 m before the first and the listener 5 m past the last, both at one height from the plane of the tops (the whole early stage with the paths in pressure up to 500 Hz):
edges in a row, |
63 |
125 |
250 |
500 |
1000 |
2000 |
4000 |
8000 |
|---|---|---|---|---|---|---|---|---|
two screens 10 m apart, 1 cm above |
-8.89 |
-9.48 |
-9.86 |
-9.89 |
-10.28 |
-10.26 |
-10.27 |
-10.46 |
in the plane |
-9.34 |
-9.90 |
-10.32 |
-10.42 |
-10.87 |
-10.91 |
-11.00 |
-11.28 |
1 cm below |
-9.91 |
-10.58 |
-11.06 |
-11.41 |
-12.17 |
-12.25 |
-12.34 |
-12.46 |
three screens 5 m apart, 1 cm above |
-9.75 |
-7.96 |
-8.07 |
-8.00 |
-7.41 |
-7.45 |
-7.58 |
-8.08 |
in the plane |
-9.28 |
-7.48 |
-7.55 |
-7.47 |
-6.82 |
-6.87 |
-7.02 |
-7.57 |
1 cm below |
-9.91 |
-10.58 |
-11.06 |
-11.41 |
-12.17 |
-12.25 |
-12.34 |
-12.46 |
one top 10 m wide, 1 cm above |
-5.25 |
-5.46 |
-5.61 |
-5.69 |
-5.91 |
-5.91 |
-5.89 |
-5.84 |
in the plane |
-5.17 |
-5.43 |
-5.60 |
-5.73 |
-6.02 |
-6.02 |
-6.02 |
-6.02 |
1 cm below |
-5.23 |
-5.50 |
-5.71 |
-5.86 |
-6.09 |
-6.17 |
-6.27 |
-6.40 |
two tops 5 m wide, 5 m apart, 1 cm above |
-7.05 |
-6.21 |
-6.31 |
-6.34 |
-6.25 |
-6.25 |
-6.26 |
-6.31 |
in the plane |
-10.94 |
-12.29 |
-13.19 |
-13.97 |
-14.38 |
-14.53 |
-14.78 |
-15.55 |
1 cm below |
-5.26 |
-5.52 |
-5.71 |
-5.85 |
-6.08 |
-6.16 |
-6.27 |
-6.39 |
a 10 m top with a 2 cm slot, 1 cm above |
-6.35 |
-6.46 |
-6.32 |
-6.27 |
-6.66 |
-6.65 |
-6.61 |
-6.57 |
in the plane |
-7.76 |
-9.48 |
-10.54 |
-11.12 |
-11.75 |
-11.88 |
-11.96 |
-12.01 |
1 cm below |
-5.23 |
-5.50 |
-5.71 |
-5.86 |
-6.09 |
-6.17 |
-6.27 |
-6.40 |
three tops 3 m wide, 2 m apart, 1 cm above |
-1.89 |
-1.75 |
-1.45 |
-1.28 |
-0.94 |
-0.93 |
-0.95 |
-1.03 |
in the plane |
-8.80 |
-4.77 |
-4.70 |
-4.47 |
-3.71 |
-3.62 |
-3.59 |
-3.70 |
1 cm below |
-5.25 |
-5.51 |
-5.70 |
-5.85 |
-6.08 |
-6.16 |
-6.27 |
-6.39 |
a top 5 m wide, then a screen, 1 cm above |
-11.00 |
-10.39 |
-10.65 |
-10.83 |
-10.85 |
-10.82 |
-10.81 |
-10.86 |
in the plane |
-11.37 |
-12.06 |
-11.26 |
-10.86 |
-10.34 |
-10.34 |
-10.39 |
-10.61 |
1 cm below |
-10.52 |
-11.01 |
-11.36 |
-11.62 |
-12.15 |
-12.23 |
-12.33 |
-12.44 |
a screen, then a top 5 m wide, 1 cm above |
-10.83 |
-10.14 |
-10.43 |
-10.61 |
-10.64 |
-10.62 |
-10.59 |
-10.67 |
in the plane |
-13.67 |
-14.28 |
-14.57 |
-14.89 |
-14.94 |
-15.02 |
-15.24 |
-15.99 |
1 cm below |
-10.65 |
-11.09 |
-11.42 |
-11.66 |
-12.14 |
-12.22 |
-12.31 |
-12.44 |
Over one top the level is within 0.9 dB of half the direct sound, above its plane, in
it and below. A path over two edges is all the engine has of more edges in a row, and
there is no exact solution here to hold it against. Three screens leave 1.5 to 2.9 dB
more than two from 125 Hz up, a centimetre above their tops, where a screen more
should leave less; a slot 2 cm wide across the 10 m top, far narrower than the
wavelengths up to 500 Hz, lowers the level by 0.6 to 1.1 dB; over three tops in a row
the level is 3.4 to 5.0 dB above that over one. Over a top 5 m wide and then a
screen level with it, 5 m past it, the level a centimetre above their plane is the
same with the source and the listener swapped, within 0.15 dB. Closer to the top or
to the plane two things count. A path over the screen’s top reflects off the top’s
plane where its own line meets that plane: with the two level, at the screen’s top
itself, where the top is not, so that it is no path, whatever the ray that looks for
it meets from its start a millionth of the model’s size off the edge; and the
screen’s top lies beside the reflection off the top, before the point of reflection
one way round and after it the other, and takes its term on that leg. In six cases from a millimetre to a metre above the plane, the screen 0.1 to 5 m
past the top, the two ways round agree within 0.05 dB (tests/test_diffraction.py),
in four of them with every sequence of reflections tested (method: image_sources),
as the rays can find the reflection between the top’s wall and the screen one way
round only (see Known issues). With the screen 0.1 m past the top
and its top a micrometre above the top’s plane or below it, the level a centimetre
above is that of a level top within 0.04 dB with first_order and, a micrometre
above, within 0.34 dB up to 500 Hz with second_order (below the plane and above
500 Hz it is not: see Known issues). Where such a screen ends 1 cm to
0.5 m beside the way, the level 1 or 2 mm above the plane is, with second_order,
that a centimetre above: between two tops within 0.23 dB (0.39 dB with the way
through the screen’s end), and 5 m before a top or 5 m past it within 0.64 dB, both
ways round. A centimetre above, with the screen first and the way a centimetre inside
its end, it is up to 500 Hz 0.5 to 1.2 dB above half the sum of the fields without
the screen and with an endless one (Kirchhoff’s approximation for the way through the
screen’s end, -6.2 to -6.8 dB), each from the two-dimensional wave calculation of the
Known issues; first_order is 7.4 to 9.3 dB below that. Exactly in
the plane of several flat tops the
level is off by more: 3.9 to 9.2 dB below that a centimetre above the plane of two
tops, 2.5 to 6.9 dB below it over three and 2.8 to 5.3 dB below it over a screen and
then a top, where a top and then a screen is within 1.7 dB of it. It is off within
two millionths of the model’s size below the plane too (1.2 mm here), where the rays
that look for paths over edges, which start a millionth of the model’s size off the
edges, find paths that are not there: 0.01 mm below the plane of two tops the level
is at +3.3 to +4.1 dB, and below that of three at +9.1 to +10.0 dB. In the bands that
add in energy the levels up to 500 Hz are those of the table within 1.7 dB, but at
63 Hz for three screens above their tops and level with them (2.5 and 2.6 dB higher),
exactly in the plane of a slotted top (2.1 dB lower) and of three tops (4.9 dB
higher). first_order
has no path over two edges: a centimetre above two tops it is at -0.4 to -1.5 dB, and
above three at +4.9 to +5.8 dB (see Known issues).
At the corner of a thin screen, the quarter of the plane x = 0 below y = 0 and z = 0,
the source at (-5, -3, -1) and the listener walking from (5, 2.5, -2) to (5, 4, -2)
1 cm at a time with direct and every band in pressure, the direct sound comes round
the screen’s side edge at y = 3. The exact level, BTM over both edges, each from the
corner on (the sound from one edge to the other left out), changes smoothly there; the
engine’s steps:
a screen’s corner, |
63 |
125 |
250 |
500 |
1000 |
2000 |
4000 |
8000 |
|---|---|---|---|---|---|---|---|---|
largest step, engine |
0.01 |
0.01 |
0.03 |
0.06 |
0.05 |
0.07 |
0.10 |
0.15 |
largest step, BTM |
0.00 |
0.01 |
0.02 |
0.06 |
0.04 |
0.07 |
0.10 |
0.15 |
largest difference, engine - BTM |
0.06 |
0.01 |
0.05 |
0.01 |
0.00 |
0.01 |
0.00 |
0.10 |
The path over the top edge still touches it 8 cm from the corner there as the direct sound appears round the side edge. Each edge’s term takes the part of its Fresnel zone that the edge covers, the two edges sharing it at the corner, so both change smoothly there. With the terms stopping at the ends, as the UTD has them, the level steps by 2.82 dB at 63 Hz (1.37 dB at 250 Hz) and is up to 1.83 dB off.
The two halves add up so only where the edges are square (within 1°). At any other angle, and where a screen’s top bends, each of an edge’s four terms takes the edge’s own part of it as BTM’s integrand weights the edge near the point the path touches: by 1 / (t² + v²) with the Fresnel integral’s phase, v being how far the term is from its shadow or reflection boundary in the Fresnel integral’s argument t. On its boundary a term then comes from that point alone, so it keeps its whole step while the point lies on the edge, and the other edge’s term takes it over past the end. A screen in x = 0 with a corner of 45° to 170° at the origin (at 45° also with one edge upright), the source at (-5, -3, -1) and the listener walking from (5, -1, -2) to (5, 6, -2) 5 cm at a time across both edges’ boundaries, BTM over both edges at 96 frequencies in a band:
corners of other angles, |
63 |
125 |
250 |
500 |
1000 |
2000 |
4000 |
8000 |
|---|---|---|---|---|---|---|---|---|
45° and 60°, largest difference |
0.09 |
0.07 |
0.06 |
0.07 |
0.03 |
0.03 |
0.08 |
0.10 |
120° to 170°, largest difference |
0.05 |
0.08 |
0.07 |
0.04 |
0.05 |
0.12 |
0.10 |
0.17 |
The steps are BTM’s within 0.07 dB. With each edge taking the Fresnel integral’s share (halved at 45° to 120°), the level stepped by up to 3.0 dB at 125 Hz at the corner of 45° with an upright edge and was up to 2.7 dB off; at the other corners it was 0.3 to 1.1 dB off.
A screen whose top bends: two screens below z = 0 that meet along the z axis, one in x = 0 for y < 0, the other turned about the z axis by 2, 5, 10 or 14°, away from the source or towards it. The source is at (-5, -0.5, -1); the listener rises 1 cm at a time through the top’s shadow boundary from z = 0.9 to 1.1 m at (5, -0.5, z) and (5, 0.3, z), where the line to the source passes the top 0.5 and 0.1 m from the bend, and walks deep in the shadow from (5, -1, -2) to (5, 3, -2) 5 cm at a time; BTM is taken over both tops from the bend on:
a bent screen, |
63 |
125 |
250 |
500 |
1000 |
2000 |
4000 |
8000 |
|---|---|---|---|---|---|---|---|---|
across the boundary, largest difference |
0.03 |
0.01 |
0.01 |
0.01 |
0.00 |
0.00 |
0.00 |
0.00 |
deep in the shadow, largest difference |
0.04 |
0.02 |
0.01 |
0.01 |
0.02 |
0.01 |
0.01 |
0.01 |
Both ways round the steps are BTM’s within 0.03 dB. With each top taking the Fresnel integral’s share of its terms, the level 0.1 m from the bend was up to 5.3 dB too high across the boundary with the bend away from the source, stepping by 5.4 dB, and up to 16.4 dB too low with it towards the source, stepping by 16.6 dB.
Only a thin screen’s edges fade so. At the corners of a solid block, where three right-angled edges meet, the terms still stop at the ends. The block runs from x = 0 to 2 m and y = -10 to 0 m, with its top at z = 0, open underneath and reaching far down. The source is at (1, 3, 1), and the listener walks from (4, -8, h) to (4, 2, h), 5 cm at a time, at h = 0.3 and 1.8 m, past where the paths over the block’s edges reach its corners. BTM is taken over each of its edges, from end to end, with the geometric paths:
a block’s corners, |
63 |
125 |
250 |
500 |
1000 |
2000 |
4000 |
8000 |
|---|---|---|---|---|---|---|---|---|
0.3 m up: largest step, engine |
2.25 |
1.83 |
0.99 |
0.29 |
1.11 |
0.48 |
0.07 |
0.08 |
largest step, BTM |
0.11 |
0.03 |
0.03 |
0.04 |
0.04 |
0.05 |
0.04 |
0.03 |
largest difference, engine - BTM |
2.29 |
1.50 |
1.62 |
0.46 |
1.44 |
0.59 |
0.14 |
0.14 |
1.8 m up: largest step, engine |
2.41 |
2.06 |
0.47 |
1.97 |
0.96 |
0.99 |
0.62 |
0.44 |
largest step, BTM |
0.04 |
0.03 |
0.04 |
0.04 |
0.04 |
0.04 |
0.05 |
0.11 |
largest difference, engine - BTM |
1.96 |
1.45 |
0.92 |
1.89 |
0.97 |
0.89 |
0.58 |
0.50 |
Fading the three edges’ terms at each corner as at a screen’s corner, in a one-off check, halved the largest steps 0.3 m up (1.17 dB at 63 Hz). But it put the level up to 1.25 dB above BTM at 63 and 125 Hz from y = -4 to 0 m, where stopping is within 0.36 dB. A model of such corners is an open item on the roadmap.
The early stage of a hall 30 x 20 x 10 m with four alcoves along each long wall
(16 vertical edges), with the source and the listener in alcoves out of each other’s
sight, takes 44 ms per source and listener on four cores without diffraction (23
paths), 525 ms with first_order (979 paths) and 600 ms with second_order (993
paths): the median of four timings, each the mean of three runs after a first one,
with nothing else running on the machine (10 November 2026, the middle of three such
medians). The terms that make the other specular paths fade at the edges (next section)
give most of the paths, as each term is a path over its edge, and so is each product of
terms. In a one-off check when they were written, on a run where the early stage took
650 ms with first_order and 710 ms with second_order, they took about 580 ms of the
first; without them it took 70 ms (71 paths) and 135 ms (86 paths), and 4.0.0 took
about 1.0 and 1.1 s on the same computer.
Reflections that fade at edges against the exact solution
validation/edge_fade.py checks the terms that make every specular path fade in and out
at edges (see Simulation) where the exact solution is
known: a vertical edge standing on a rigid ground. The ground mirrors the edge into
itself, so the sound is that of an edge infinite in height from the source and from its
image in the ground: the geometric paths of each that reach the listener, plus each
one’s BTM term (as above). The source stands 0.5 m up, and a listener 1.5 m up walks
across the edges’ boundaries 1 cm at a time:
the end of a thin screen, with
diffraction: direct: the reflection off the ground crosses the shadow boundary with the direct sound, and only the fade bends it;the corner of a building (a right-angled wedge), with
directand withfirst_order: the listener passes the boundary of the reflection off one wall and then the corner’s shadow boundary, each with its copy off the ground. Withfirst_orderthe edge diffraction bends all of those paths itself, and the fade must add nothing to it;a strip 2 m wide (a thin screen on the ground), with
directand withfirst_order: the listener, on the source’s side, walks through the reflection off the strip, which a face that narrow gives only in part at low frequencies;a gap of 4 m between two screens in line, with
direct: behind one screen’s end, through the gap and behind the other’s.
For the strip and the gap the exact level adds each end’s term to the geometric paths and leaves out the sound diffracted from one end to the other (at the strip it changes the level by at most 0.1 dB, at 63 to 250 Hz). Everything adds in pressure, as outdoors, and the exact level is averaged over 96 frequencies in each octave band. The largest difference from it along each line, in dB:
largest difference from the exact level (dB) |
63 |
125 |
250 |
500 |
1000 |
2000 |
4000 |
8000 |
|---|---|---|---|---|---|---|---|---|
screen end, |
0.04 |
0.02 |
0.01 |
0.01 |
0.01 |
0.00 |
0.01 |
0.01 |
without |
5.90 |
5.79 |
5.30 |
3.77 |
5.26 |
4.43 |
3.72 |
3.72 |
building corner, |
0.08 |
0.05 |
0.02 |
0.01 |
0.01 |
0.01 |
0.02 |
0.04 |
without |
5.93 |
5.85 |
5.52 |
4.11 |
5.22 |
4.48 |
3.64 |
3.52 |
building corner, |
0.08 |
0.05 |
0.02 |
0.01 |
0.01 |
0.01 |
0.02 |
0.04 |
without |
0.08 |
0.05 |
0.02 |
0.01 |
0.01 |
0.01 |
0.02 |
0.04 |
2 m strip, |
0.02 |
0.01 |
0.01 |
0.00 |
0.00 |
0.00 |
0.01 |
0.19 |
without |
0.90 |
0.54 |
0.97 |
1.71 |
0.18 |
0.64 |
0.41 |
0.45 |
2 m strip, |
0.02 |
0.01 |
0.01 |
0.00 |
0.00 |
0.00 |
0.01 |
0.19 |
without |
0.42 |
0.27 |
0.29 |
0.14 |
0.01 |
0.01 |
0.01 |
0.19 |
4 m gap, |
0.03 |
0.02 |
0.01 |
0.00 |
0.01 |
0.00 |
0.00 |
0.01 |
without |
7.01 |
5.57 |
5.25 |
3.67 |
6.05 |
4.45 |
3.92 |
3.71 |
With the fade the level changes from one listener to the next as the exact level does:
the largest step along each line is the same as the exact level’s to 0.01 dB in every
band, at most 0.20 dB at 8 kHz past the screen’s end, but for 8 kHz on the strip, where
it is 0.06 dB and the exact level’s 0.13 dB. There the exact level is the one off: its
average over 96 frequencies swings round one over 768 by up to 0.19 dB near y = -1 m,
which makes the strip’s 0.19 dB at 8 kHz in the table, and steps by 0.03 dB where it
stepped by 0.13 dB; at every fourth listener along the line the engine is within 0.001
dB of the average over 768. Without the fade the level stepped by up to 8.6 dB past the
screen’s end, 7.6 dB past the corner and 9.2 dB past the gap’s ends. At the corner with
first_order the fade changes the level by less than 0.001 dB: where the edge
diffraction already bends a path, the fade leaves out the terms it adds. On the strip
with first_order the edge diffraction bends the reflection off the strip, and the fade
adds its copy off the ground (0.4 dB at 63 Hz).
Behind a barrier 3 m high on a rigid ground (a thin screen across x = 0), with the
source at (-4, 0, 0.5) and a listener at x = 4 m rising from 1 to 8 m 1 cm at a time,
the exact level is that of the geometric paths and of the four paths over the top, from
the source and its image in the ground to the listener and its image, each by BTM. With
first_order every path over the top is the edge diffraction’s own, and the fade
changes nothing (less than 0.001 dB):
barrier on a rigid ground, |
63 |
125 |
250 |
500 |
1000 |
2000 |
4000 |
8000 |
|---|---|---|---|---|---|---|---|---|
largest difference, |
2.20 |
2.98 |
2.60 |
0.89 |
0.80 |
0.67 |
0.76 |
0.73 |
largest difference, |
0.03 |
0.02 |
0.03 |
0.01 |
0.03 |
0.05 |
0.04 |
0.05 |
largest step, |
0.06 |
0.14 |
0.12 |
0.05 |
0.09 |
0.15 |
0.20 |
0.16 |
largest step, exact |
0.06 |
0.14 |
0.12 |
0.05 |
0.09 |
0.15 |
0.21 |
0.16 |
one_side leaves out the fourth path, reflected off the ground before the top and
again after it (see Outdoor results).
With both_sides the level is within 0.05 dB of the exact level in every band, and
steps as it does. Up to 4.0.1 it stepped by 0.35 dB at 63 Hz (one_side by 0.33 dB) at
z = 6.5 m, where the listener rises into sight of the reflection off the ground before
the barrier, and was 0.33 dB low on average above (0.38 dB at most): the path over the
top with the reflection off the ground behind it was left out there. Both reflections
come from the source’s image in the ground, and the edge diffraction took the one it
found for the geometric wave of both.
Behind a barrier 1 m thick on the same ground (two right-angled edges 1 m apart, 3 m
up), with the source at (-5, 0, 0.5), second_order and listeners 5 m behind it, the
exact level is BTM’s sound over both edges from the source and its image to the
listener and its image (up to about 4 minutes a listener). The engine minus the exact
level:
thick barrier, |
63 |
125 |
250 |
500 |
1000 |
2000 |
4000 |
8000 |
|---|---|---|---|---|---|---|---|---|
listener 0.5 m up |
-9.85 |
-6.96 |
+3.01 |
-5.66 |
-5.54 |
-5.18 |
-5.08 |
-5.40 |
1.5 m up |
-5.06 |
-0.27 |
-0.49 |
-3.20 |
-2.44 |
-2.14 |
-2.17 |
-2.41 |
2.5 m up |
-1.09 |
-5.48 |
+3.83 |
-2.53 |
-2.11 |
-1.89 |
-1.75 |
-1.90 |
A path over two edges takes no reflection off the ground, so of the four paths over
the barrier the engine has one: 1.7 to 5.7 dB low from 500 Hz up, and up to 9.9 dB low
and 3.8 dB high below, where the four interfere. both_sides, which pairs reflections
round one edge, and the fade change nothing here (see Known issues).
Round a corner indoors
Indoors the paths that pass an edge reflect off the floor, the ceiling and the walls
several times, and their sounds add in energy above 125 Hz (each band’s level is the
sum of its paths’). No exact solution covers a whole room, so the check is that the
level no longer jumps where a path appears or goes: the gallery example’s visitor
walks away from the guide and round the corner at (8, 8) m, 1 cm at a time from y = 6
to 18 m along x = 3, 4 and 5.5 m (3,603 positions), with reflections up to third order
and first_order, as the example has them. The largest step between neighbours, in
dB:
largest step (dB) |
63 |
125 |
250 |
500 |
1000 |
2000 |
4000 |
8000 |
|---|---|---|---|---|---|---|---|---|
with the fade |
0.06 |
0.10 |
0.02 |
0.03 |
0.04 |
0.05 |
0.07 |
0.13 |
without |
3.03 |
3.72 |
2.38 |
2.52 |
2.64 |
2.73 |
2.78 |
2.83 |
The largest steps left stand out from their neighbours’ by at most 0.08 dB, all at 63
and 125 Hz; from 250 Hz up by at most 0.01 dB. The
largest, 0.08 dB at 125 Hz between y = 13.33 and 13.34 m on x = 5.5 m, and a smaller
one at 63 Hz near y = 9.81 m on x = 4 m come from a path that the corner stops on one
leg while another of its reflection points slides past the end of its face into a
corner of the room: the path is left out there, though its path over the corner still
reflects on the face. The largest on x = 3 m at 125 Hz, 0.02 dB between y = 12.99 and
13.00 m, is a leg that takes the corner’s term on the lit side on one side of the step
and not on the other; the others, of up to 0.035 dB (63 Hz, y = 12.00 m on x = 4 m),
are not traced. validation/walks.py prints how far the steps stand out on each line,
and where.
Where the edge diffraction already bends every path the early stage follows
(max_order: 0 with direct, max_order: 1 with first_order), the fade changes the
level along x = 4 m by less than 0.05 dB (a one-off check). It had taken away the
terms of reflections off faces the listener was behind, which the early stage follows
nowhere at that order:
2.9 dB less at once at 63 Hz behind the plane of the wall round the corner.
Along a street
The street example’s car (see Vehicles passing by)
passes the pavement, a balcony of the office block, the point 2 m in front of the
offices’ wall (balcony_2m) and the garden behind the noise barrier.
No exact solution covers a street either, so the check is again that the level does not
jump: the early level, A-weighted with the car’s sound power, every 10 cm of the car’s
125 m, and again 1 cm apart round each step of 10 cm that is among the four largest for
its listener in some band or in dB(A) (validation/walks.py). Outdoors paths
add in pressure in every band, so the level also swings, smoothly, where they go in
and out of step: at 8 kHz, where a centimetre is a quarter of a wavelength, the
garden’s level changes by up to 0.75 dB from one centimetre to the next. The late part
is left out, as its rays are drawn at random (the early level repeats to the last
bit): with the scene’s rays few of them reach the garden, and in a one-off check two
runs of the same pass without a seed (the car’s levels of 4.1.0, every metre, as
passby_demo.py walk simulates it) put the garden’s level up to 2.1 dB(A) apart at one
place (x = -35 m; 0.37 dB(A) rms over the pass), the pavement’s and the balcony’s up to
0.6 and 0.8 dB(A); their L_Amax came within 0.04 dB on the pavement and in the garden
and 0.17 dB apart on the balcony.
On the pavement, the balcony and balcony_2m the early level changes by at most 0.17,
0.16 and 0.13 dB(A) from one 10 cm to the next, and in the garden by at most 1.39 dB(A),
where 1 kHz swings by 2.5 dB at x = 28.8 m and does so smoothly 1 cm apart; without the
fade the garden’s level steps by up to 12.1 dB(A) from one 10 cm to the next. The steps
left that stand out by more than 0.1 dB in some band 1 cm apart, but at 8 kHz, where a
centimetre is a quarter of a wavelength and the level swings by up to 0.75 dB from one
to the next (five more at 4 kHz in the garden, at x = 19.40, 19.51, 28.69, 28.72 and
28.88 m, are swings too: in a one-off check 1 mm apart the level there changed by at most
0.08 dB a millimetre at 4 kHz), each the step from 1 cm before x to x, and how far it
stands out in dB(A) and in the same band without the fade (validation/walks.py):
car at x (m) |
listener |
stands out (dB) |
in |
dB(A) |
without the fade (dB) |
|---|---|---|---|---|---|
-41.39 |
garden |
1.11 |
1 kHz |
0.55 |
0.00 |
-39.92 |
balcony |
0.16 |
63 Hz |
0.00 |
0.00 |
-14.07 |
garden |
0.80 |
125 Hz |
0.31 |
0.00 |
9.99 |
garden |
0.83 |
63 Hz |
0.04 |
0.97 |
10.01 |
balcony_2m |
0.10 |
125 Hz |
0.00 |
0.08 |
10.02 |
garden |
1.05 |
63 Hz |
0.12 |
0.96 |
14.28 |
balcony_2m |
0.17 |
125 Hz |
0.00 |
0.04 |
15.98 |
balcony_2m |
0.16 |
125 Hz |
0.00 |
0.03 |
16.01 |
balcony_2m |
0.11 |
125 Hz |
0.00 |
0.03 |
18.93 |
balcony_2m |
0.17 |
125 Hz |
0.03 |
0.00 |
25.31 |
balcony |
0.14 |
63 Hz |
0.00 |
0.00 |
37.20 |
garden |
0.52 |
500 Hz |
0.02 |
0.00 |
53.96 |
pavement |
0.13 |
250 Hz |
0.00 |
0.04 |
60.03 |
balcony |
0.30 |
63 Hz |
0.05 |
0.00 |
60.19 |
balcony_2m |
0.33 |
63 Hz |
0.05 |
0.00 |
60.70 |
pavement |
0.29 |
250 Hz |
0.00 |
0.00 |
63.10 |
pavement |
0.21 |
63 Hz |
0.00 |
0.00 |
65.34 |
balcony_2m |
0.22 |
500 Hz |
0.09 |
0.00 |
66.62 |
balcony |
0.15 |
63 Hz |
0.06 |
0.00 |
The paths over the barrier’s top and round its end at x = 44 m, the edge diffraction’s
own and the fade’s terms of the same paths, fade out past the ends, as the barrier is a
thin screen. The steps left are terms that still stop where the point they diffract at
leaves the end of its edge (see Known issues), where
traced (all but those at 9.99 to 10.02, 14.28, 53.96 and 63.10 m): mostly the fade’s
terms of second-order reflections that the barrier’s top (x = 14 to 44 m), its end or a
corner of the offices or the houses cuts off, which the edge diffraction (first_order)
has no path for, and at 15.98 m the path over the houses’ eaves, a solid wedge, at their
end. The largest in dB(A), at -41.39 m, is the term of a reflection off the houses’
front and the offices’ façade that reaches the top’s end at x = 14 m. The dips at 9.99
and 10.02 m are the next paragraph’s. tests/test_walks.py walks the garden round three
of the largest steps left and the one at 60.80 m that the fade past the barrier’s end
took away in CI, and holds them to 1.5 dB in a band and 0.6 dB(A).
At x = 10.0 m, where the car crosses the plane of the houses’ end wall, the sound over
the houses’ corner dips by up to 10 dB at 63 Hz within 2 cm (1.0 dB in the garden’s
level over 1 cm). It is the edge diffraction’s own term, with or without the fade: it
gives the wall’s reflection the factor of a plane wave, which for the brick’s impedance
turns to -1 at grazing incidence, so that the reflection cancels the incident sound
there. With a rigid wall the dip is gone. A face with an absorption coefficient does the
same in the bands that add in pressure, which take only the phase of that factor: it is
turned over while the incidence cosine is below the fitted admittance, so for a source
(not a listener: the path is then not the same both ways round) that close to the
face’s plane. A source 0 to 1 cm above the plane of the top of the 1 m block of
tests/test_diffraction.py (absorbing 0.02, admittance 0.0026), 3 m in front of it,
hears the far corner 14.9 to 18.7 dB below the reversed path, and the paths over both
corners (second_order), which continue that path there, 2.9 to 6.1 dB below; from about
1 cm up the two agree again. Each of these reflections turns over at its own cosine: the
specular one off the top at its reflection point, those of the paths over each corner at
the source’s cosine to that corner. With the source and a listener rising together 3 m
either side of that block, the level at 63 and 125 Hz is therefore above the rigid
block’s from the height where the near corner’s turns to where the far corner’s does: by
up to 16 dB with only the top absorbing 0.2 (9.2 to 12.3 cm, the most at 10.8 cm) and
9.6 dB at 0.5 (31.2 to 41.6 cm), with second_order (14.9 and 9.2 dB with
first_order). The reflection off the ground takes the
factor of a spherical wave instead (see
Ground reflection), as does the wave
along a face from one edge to the next on a path over both; whether that factor would
also be the better one here is not checked.
Where the source or the listener rises through the plane of an absorbing top, the level steps. Below the plane only the paths over both corners reach, and they take the ground wave’s loss along the top; above it the path over the far corner alone takes none, as its reflection off the top takes the plane wave’s factor (in the bands that add in energy, its specular share alone). Over the 1 m block, with the source 3 m in front and the listener 3 m behind and 1.5 m below the top or the other way round, from 1 mm below the plane to on it, the level steps by up to 2.2 dB at absorption 0.1 and 12.9 dB at 0.5 (at 8 kHz), and over a block 10 m wide by 7.1 and 28.7 dB; before the paths over both corners took the ground wave these steps were at most 0.47 and 2.58 dB. A listener steps as much in pressure; a source is then in the dip above. The paths over both corners, weaker by the ground wave, also take less of the far corner’s wave away above the plane: with absorption 0.5 and the source in it, the level at 8 kHz is 3.5 dB above the rigid block’s in energy. Giving that reflection the spherical wave’s factor as well would change every path over one edge with an absorbing face, and is not done.
A reflection off a face with an absorption coefficient takes, in the bands that add in pressure, the square root of (1 - the absorption) with the phase of the plane wave’s factor, whatever the size of the face, and near grazing incidence that is wrong for a large face as for a small one. With a source and a listener 0.1 m above a rigid floor 600 m wide and 10 m apart (incidence cosine 0.020), and a square absorbing 0.5 (fitted admittance 0.10) centred on the specular point, the phase is turned over and the engine gives -10.7 dB against the free field at 63 and 125 Hz for a square 1 m, 80 m or 400 m wide, as by hand (the direct sound and a reflection of the square root of 0.5 turned over, -10.66 dB). The exact solution over an unbounded plane of that material gives +3.3 and +2.2 dB, and first-order (Born) theory, the square’s own scattering added to the rigid floor’s field, +6.0 dB over the 1 m square (and 3.5 and 2.8 dB over the 80 m one). Moved sideways until the reflection point leaves the 1 m square (from 0.49 to 0.51 m off the path), the engine’s level steps by 16.7 dB, to the rigid floor’s +6.0, where Born theory gives +6.0 dB on both sides.
Known issues of the edge fade
Paths that several events stop. A path that is not found is followed where one edge explains each run of the events that stop it, or two edges explain them between them, in at most two runs. Elsewhere it is left out with its terms, as where one of its reflection points slides into a corner of the room while the path over the edge still reflects on the face, which makes the steps of up to 0.08 dB left round the gallery’s corner (see above). The edge diffraction’s own paths over an edge with a reflection before or after it stop where that reflection leaves its face, which the fade makes up for where it follows the path. A leg that two obstacles block, or two sides of one, is one event, which no one edge explains: behind two barriers 4 m apart, a U-shaped or a Z-shaped one, on a rigid ground, the level steps by up to 2.6 dB in a band from 63 to 250 Hz, along the one line of listeners measured, where the reflection off the ground crosses the first one’s foot, and behind the U by 2.0 dB (
second_order; 9.4 dB withfirst_order) where it lies just behind the first side’s foot and the path round that side’s end leaves its foot.Corners of edges. Over the edge of a thin screen (a barrier’s top and ends, a face’s free edge) a path’s term takes the part of its Fresnel zone that the edge covers, as BTM’s integral over a finite edge has it (at a free end, a bend or a corner that is not square, each of its terms weighted for the term’s boundary), so it fades out past a free end (see Edge diffraction against the exact solution). Elsewhere a term stops where the point it diffracts at leaves the end of its edge, as the UTD has no terms for the corners of edges, unless that end lies in a plane the path reflects off next to the event, where the edge goes on as its image in the plane (for a leg that stops a path, the image’s term is found on the leg on the other side of the reflection): at the edges of solid wedges, on paths over two edges (
second_order) and for the fade’s terms of paths the edge diffraction does not have, such as second-order reflections that an edge cuts off. Near a solid block’s corners the level steps by up to 2.4 dB at 63 Hz and is up to 2.3 dB from BTM (see above); along the street such terms step by up to 1.11 dB in one band and 0.55 dB(A) (see above). A path over two edges stops likewise where it leaves the end of one of them, while the paths over each edge alone fade out past the end: just over the tops of two barriers in a row, the source and the listener both within a centimetre of the line of the tops, the level steps by 3.5 dB at 63 Hz and 5.5 to 6.2 dB from 1 kHz up where the way passes the end of one of the two (by 3.5 to 4.3 dB up to 1 kHz with both 0.1 m above the line, and by 2.8 dB at 63 Hz and 0.5 dB or less from 1 kHz up with both 0.5 m above it; a one-off check). At the end the level is, by symmetry, midway in pressure between those over one barrier and over both: from 2 kHz up the engine is 4.1 dB below that just outside the end and 2.0 dB above it just inside. Over the end of a barrier that stands oblique to the way, the point where the path over both tops touches that top moves along it with the height above the tops: with the way through the end of a barrier at 40 degrees to it, 10 m behind a long one, the level is at -6.2 dB (63 Hz) and -8.5 dB (8 kHz) up to 2.5 mm above the tops, as over a square end, and from 3 mm up at -4.8 and -6.0 dB with the barrier turning one way and at -7.7 and -11.8 dB with it turning the other (at 70 degrees from 1 mm up). The fade’s terms of a reflection that an edge cuts off belong to the reflections the source’s rays find, so those of the reflection off a second screen and back off the first are there with the source on one side and not with the two swapped: level with the tops of two screens 10 m apart, a centimetre beside where the first one’s top drops by a metre, swapping them changes the level by 0.4 to 0.6 dB withsecond_orderand, withfirst_order, whose level there is 17 to 39 dB down, by up to 8.2 dB. Likewise just above a flat top and a screen level with it close past it, where the reflection between the top’s wall and the screen counts: swapping the source and the listener changes the level up to 500 Hz by up to 0.4 dB a centimetre above their plane with the screen 0.5 to 2 m past the top and a tenth of a metre above it with the screen 0.1 m or less past it, and by up to 0.7 dB a metre above it. Withmethod: image_sources, which tests every sequence of reflections, the two ways round agree within 0.05 dB there (0.25 dB a tenth of a metre above with the screen 1 cm past the top). They do not past the end of a screen 5 m before a top 5 m wide and level with it, a centimetre above their plane and 1 or 10 cm inside the screen’s end: one way round the fade follows the reflections off the top’s wall with their copies in the top’s plane, the other way without them, and the levels are 0.7 to 1.3 dB apart up to 500 Hz (2.3 to 4.0 dB withfirst_order). A model of those corners and terms is an open item on the roadmap.tests/test_walks.pyholds the garden’s four largest steps to 1.5 dB in a band and 0.6 dB(A).Terms that cancel, in the bands that add in energy. Indoors paths add in energy from 250 Hz up (
coherent_max_band_hz). Where both edges of a narrow face border its reflection, their terms nearly cancel there at low frequencies; added in energy they would add up instead. The terms are therefore kept as waves (engine.clustersin the API reference): on the lit side of its boundary a term continues its geometric wave as far as it is coherent with it over the band, as it arrives later by its detour, and on the dark side, where that wave is gone, by the UTD’s share, so that deep in a shadow all the terms of an edge are one wave; the rest of the term is part of its event’s diffracted wave, with the terms of the event’s other edges and the edge diffraction’s paths there. The products of a path’s terms split term by term, the events the path gets past included. A wave’s energy is that of its pieces added up in pressure, averaged over each band’s frequencies and the slices they stand for, never below nothing; the wave of a found path is the path’s, and where its pieces’ cross terms take more than it has, the rest comes off them in proportion. Walking thearchway’s listener behind the wall 1 cm at a time (x = 7.6 m, y = 5.3 to 7.8 m), where the reflection off the arch’s jamb, 40 cm deep, appears, the level steps by at most 0.08 dB from 250 Hz to 1 kHz, between y = 5.39 and 5.40 m (see the next item), and by at most 0.16 dB from 2 kHz up. The edge diffraction’s own paths, without the fade, step there by up to 0.73 dB at 63 Hz, 1.46 dB at 125 Hz and 1.88 dB from 250 Hz up. Averaged over the walk, in a one-off check, the level was 0.15 dB below that with every band in pressure (coherent_max_band_hz: 8000) at 250 Hz, 0.67 and 0.58 dB above it at 500 and 1000 Hz and 0.11 to 0.43 dB below it from 2 kHz up. Before the paths over two edges along an absorbing face took the ground wave, which in pressure they had all but lost, it was 0.39, 1.12 and 0.73 dB above it at 250, 500 and 1000 Hz; the rest of the difference is not traced.Cut off by a thick end. Behind the
archway’s wall the level steps by 0.56 dB at 63 Hz and 0.27 dB at 125 Hz between y = 5.39 and 5.40 m (at 63 Hz by 0.28 dB more to 5.41 m), and by 0.08 dB or less from 250 Hz up, as it did with every band in pressure in a one-off check. Reflections that the end of the arch’s jamb cuts off are followed while the leg they are cut off on hits the end’s face, and left out once it hits the jamb’s face on the far side, 40 cm on, which is a face of the end’s other corner and not of the edge whose shadow they are in. Letting that other corner explain them removed the step but made one of 1.75 dB at y = 5.90 m, where a reflection point of one of those paths also leaves its face and the path, stopped at two events, is left out at once; so it is not done. The other steps along the walk, of up to 0.20 dB at 63 and 125 Hz and 0.07 dB from 250 Hz up, were there in pressure too (a one-off check); at y = 6.83 to 6.84 m and 7.00 to 7.01 m, terms of cut-off second- and third-order reflections come or go, and why is not traced. The fix would take a term over both corners of the end in turn, assecond_orderhas for the direct sound, which the fade does not have (an open item on the roadmap).tests/test_walks.pywalks the whole line in CI and holds the steps to 0.65 dB at 63 Hz, 0.5 dB at 125 Hz, 0.1 dB from 250 Hz to 2 kHz and 0.2 dB above.Products of terms. The terms of a path’s events multiply, as the path must get past each in turn, an approximation for terms at different edges. Each product is a path that arrives later by the detours of all its terms, an approximation too for terms bent far from their boundaries; products below -60 dB of their path are left out in the bands where paths add in pressure. Where two events meet the same edge, the product is a wave bent twice by one edge, which the exact solution does not have. It is not checked on its own; behind the corner of the tests’ L-shaped room such products come 23 dB below the paths over the corner.
Order of reflections. Where the edge diffraction does not bend it, a path of the highest order the early stage follows takes no terms for the reflections off the edge’s faces, behind their planes or in front, as the early stage follows no path with one more reflection: near an edge the level is that of the order chosen, as for the specular paths.
What is checked. Against exact solutions: vertical edges standing on a rigid ground (a screen’s end, a building’s corner, a 2 m strip and a 4 m gap) with
direct, and the corner and the strip withfirst_ordertoo; a barrier’s top on a rigid ground, with a reflection off the ground before or after it, withfirst_orderand withboth_sides; and a thick barrier withsecond_order, whose paths over two edges take no terms of the fade. Only for steps, with no exact level: paths of two or more reflections indoors (the gallery, and withsecond_orderbehind the archway) and in a street, walked in CI (tests/test_walks.py) and in full byvalidation/walks.py. Not checked: surfaces with an impedance against an exact solution. Nothing is checked against measurements.
Ground reflection against the exact solution
validation/ground_reflection.py compares the reflection off a porous ground (see
Outdoor scenes) with the exact solution for a point
source over a locally reacting plane, Sommerfeld’s integral as Chien and Soroka (1975)
write it, which the script integrates numerically. The engine reflects with the
Weyl-van der Pol factor Q, the integral’s asymptotic form. Levels are those of the
direct sound and its reflection together, in dB over the direct sound in free field.
The grounds follow Miki’s model with Nord2000’s flow resistivities; the source and the
listener are 2 and 1.2 m high 5 m apart, and 1 and 1.5 m high 20 and 100 m apart.
Q against the exact solution, the largest difference in level at the third-octave centres from 50 Hz to 5 kHz (in brackets, in dips more than 20 dB deep):
ground (flow resistivity, kPa s/m²) |
5 m |
20 m |
100 m |
|---|---|---|---|
snow (12.5) |
0.16 |
0.19 |
0.12 |
snow 10 cm deep on ice (12.5) |
0.25 |
0.36 (2.2) |
0.41 (0.8) |
grass (200) |
0.02 |
0.04 |
0.04 |
gravel (2000) |
0.00 |
0.01 |
0.01 |
asphalt (20000) |
0.00 |
0.00 |
0.00 |
Q is furthest off over the thin layer of snow, the most reactive of these grounds, and by more than half a decibel only in its deepest dips.
Extended reaction. --extended checks grounds whose impedance changes with the
angle of incidence (impedance.reaction: extended, see
Ground impedance): sound also travels sideways inside
them, and a plane wave meeting them at the angle θ from the normal meets the impedance
Zc n / sqrt(n² - sin² θ), n the ground’s complex index, and for a layer on a hard
backing that times coth(j k d sqrt(n² - sin² θ)). The exact field of a point source over
such a ground is the Sommerfeld integral with that reflection at every horizontal
wavenumber, which the fast field program (validation/ffp.py, exact in still air, see
Outdoor sound in wind against a fast field program)
integrates. The engine reflects with Q taking the impedance at the reflection’s own
angle; the table gives the largest difference in level from the exact field at the
third-octave centres from 50 Hz to 2 kHz, outside dips more than 20 dB deep, for that
and for Q with the locally reacting impedance, and how much the extended reaction tells
(the exact fields of the two reactions apart), the source 1 m and the listener 1.5 m
high:
ground (flow resistivity, kPa s/m²) |
20 m: Q at the angle |
Q local |
reaction tells |
100 m: Q at the angle |
Q local |
reaction tells |
|---|---|---|---|---|---|---|
fresh snow (5) |
0.44 |
0.94 |
0.96 |
0.11 |
0.65 |
0.66 |
snow (12.5) |
0.22 |
0.59 |
0.59 |
0.13 |
0.39 |
0.38 |
snow 10 cm deep on ice (12.5) |
1.46 |
6.36 |
3.74 |
0.37 |
2.05 |
2.45 |
forest floor (31.5) |
0.14 |
0.35 |
0.35 |
0.09 |
0.29 |
0.29 |
grass (200) |
0.06 |
0.09 |
0.10 |
0.04 |
0.09 |
0.11 |
The extended reaction tells by a tenth of a decibel over grass, by 0.3 to 1 dB over snow and forest floors and by 2.4 to 3.7 dB over the thin layer of snow, and Q with the impedance at the angle follows it to within half a decibel but over the layer, where it still misses the exact field by 1.5 dB at 20 m: Q is the locally reacting plane’s spherical wave with the impedance swapped in, and the ground wave over a layer of extended reaction is not quite that (Li, Attenborough and Heap 1998). The parabolic equation, which takes the impedance at grazing incidence, against the same exact field at 63 Hz to 2 kHz:
ground |
100 m |
400 m |
|---|---|---|
fresh snow (5) |
0.06 |
0.05 |
snow (12.5) |
0.35 |
0.05 |
snow 10 cm deep on ice (12.5) |
0.84 |
1.05 |
forest floor (31.5) |
0.37 |
0.27 |
grass (200) |
0.12 |
0.16 |
The engine’s early part over grass (image sources to first order, the direct sound and
its reflection added in pressure, as outdoors by default) against the exact solution:
the paths’ energy in each octave band, their interference averaged over the band
(coherent.total_energy), against the exact solution’s energy averaged over the same
band:
over grass, exact (dB) |
63 |
125 |
250 |
500 |
1000 |
2000 |
4000 |
8000 |
|---|---|---|---|---|---|---|---|---|
5 m, heights 2 and 1.2 m |
3.46 |
-2.07 |
1.21 |
1.10 |
0.89 |
0.80 |
0.24 |
0.25 |
20 m, heights 1 and 1.5 m |
5.46 |
4.00 |
-0.49 |
-5.28 |
2.46 |
0.19 |
1.65 |
1.93 |
100 m, heights 1 and 1.5 m |
5.49 |
2.75 |
-6.86 |
-16.69 |
-7.22 |
-0.15 |
4.61 |
2.93 |
over grass, engine - exact (dB) |
63 |
125 |
250 |
500 |
1000 |
2000 |
4000 |
8000 |
|---|---|---|---|---|---|---|---|---|
5 m, heights 2 and 1.2 m |
-0.01 |
+0.00 |
-0.00 |
-0.01 |
-0.01 |
-0.01 |
+0.01 |
-0.03 |
20 m, heights 1 and 1.5 m |
-0.01 |
-0.02 |
-0.03 |
+0.01 |
+0.00 |
-0.00 |
-0.00 |
-0.01 |
100 m, heights 1 and 1.5 m |
-0.01 |
-0.01 |
-0.07 |
+0.01 |
+0.00 |
+0.00 |
-0.00 |
-0.00 |
The ground dip near 500 Hz deepens with distance, as the reflection comes in nearer grazing. These are band averages. The level a run reports reads the bands up to 500 Hz through analysis filters instead, whose skirts reach into the neighbouring bands, and there a sharp dip fills in by up to about 0.9 dB more (the grass table in Outdoor results against exact solutions).
The parabolic equation that gives the sound over the open ground in wind and
temperature gradients (see Outdoor scenes), here in
still air against the exact solution (--parabolic): the largest difference in level
at the third-octave centres from 63 Hz to 2 kHz, from a source 1 m high to a listener
1.5 m high, and from a source 119 m high (a wind turbine’s hub) to one 1.7 m high:
ground |
25 m |
100 m |
400 m |
178 m, from 119 m |
535 m |
845 m |
|---|---|---|---|---|---|---|
snow (12.5) |
0.64 |
0.38 |
0.39 |
0.26 |
0.02 |
0.04 |
snow 10 cm deep on ice (12.5) |
1.81 |
0.97 |
1.05 |
0.41 |
0.06 |
0.08 |
grass (200) |
0.13 |
0.14 |
0.16 |
0.28 |
0.02 |
0.05 |
gravel (2000) |
0.12 |
0.15 |
0.19 |
0.45 |
0.02 |
0.10 |
asphalt (20000) |
0.17 |
0.05 |
0.09 |
0.26 |
0.04 |
0.02 |
It is furthest off over the softest grounds near a low source at low frequencies (the 1.81 dB in a dip 36 dB deep at 160 Hz; the script prints where each row’s largest difference falls), where the field it starts from, which stands for the source and its image, matters most. From the hub, 178 m away, the direct sound comes in 33 degrees from the horizontal and the reflection 34, a little steeper than the engine uses the equation for: it takes it from 1.5 times the source’s and the listener’s heights together (181 m here), where the reflection comes in at 33.7 degrees or flatter, and rays nearer. So the 178 m column shows the equation just outside its range, not what a run gives there; from 535 m it is within 0.1 dB.
The wave solver fits the ground’s admittance with branches without mass (see Simulation). Over grass, against a rigid ground, with the source and the listener 1 and 1.5 m high 10 m apart, from the first 25 ms after the reflection, before anything off the grid’s edges arrives (the solver up to its 250 Hz band):
Hz |
40 |
63 |
80 |
100 |
125 |
160 |
200 |
250 |
315 |
|---|---|---|---|---|---|---|---|---|---|
exact (dB) |
-0.17 |
-0.43 |
-0.66 |
-0.98 |
-1.44 |
-2.20 |
-3.21 |
-4.73 |
-7.11 |
wave - exact (dB) |
+0.02 |
-0.02 |
+0.01 |
+0.01 |
+0.02 |
+0.02 |
+0.05 |
+0.10 |
+0.12 |
Outdoor propagation against measurements (Hannover)
The Hannover wind turbine propagation data (Könecke, Hörmeyer, Bohne and Rolfes, 2021,
DOI 10.25835/0012136, CC BY-SA 3.0) measured a wind
turbine 178, 535 and 845 m away, with microphones 1.7 m above a field on one line, in
ten spells of five minutes in different weather, and gives the loss from the nearest
microphone to the two others in the third-octave bands from 80 Hz to 2 kHz, with the
inputs and the result of the authors’ parabolic equation model.
validation/outdoor_propagation.py downloads the ten cases and builds each as the
authors modelled it: three point sources of equal power 71, 119 and 167 m up across the
rotor, a flat ground of Miki’s impedance (200 kPa s/m²), the air measured 53 m up, and
their effective speed of sound c(z) = a0 + alog ln(1 + z / z0) + alin z as a measured
atmosphere, the log term as the wind and the linear one as the temperature. The scene
runs in third-octave bands with this package’s defaults outdoors, the three sources’
energies added at each microphone.
Overall is the energy sum of the fifteen band losses, as the data gives it (so it reads about 15 dB above any one band); then the mean absolute difference from the measured loss over the bands. Each pair is at 535 m / 845 m, in dB:
case |
weather |
overall, measured |
published model |
this package |
mean difference, published model |
this package |
|---|---|---|---|---|---|---|
1 |
light downwind |
22.6 / 27.5 |
21.6 / 26.6 |
23.4 / 28.9 |
1.8 / 3.2 |
1.8 / 2.3 |
2 |
light downwind |
22.2 / 26.7 |
21.6 / 26.8 |
23.4 / 29.0 |
1.6 / 2.8 |
1.9 / 2.7 |
3 |
cross/downwind |
20.8 / 26.5 |
21.4 / 26.8 |
23.1 / 28.7 |
1.8 / 2.7 |
2.2 / 2.7 |
4 |
cross/downwind |
20.6 / 26.3 |
21.3 / 26.9 |
23.1 / 28.6 |
2.0 / 2.7 |
2.4 / 2.7 |
5 |
cross/upwind |
21.0 / 26.6 |
21.0 / 25.9 |
23.0 / 28.2 |
1.9 / 2.5 |
2.0 / 2.3 |
6 |
cross/upwind |
20.6 / 25.7 |
20.9 / 26.0 |
22.9 / 28.2 |
1.7 / 2.8 |
2.3 / 2.7 |
7 |
light upwind |
21.9 / 26.2 |
20.7 / 24.9 |
22.7 / 27.7 |
2.0 / 2.2 |
2.2 / 2.2 |
8 |
light upwind |
22.2 / 27.0 |
20.5 / 25.1 |
22.7 / 27.9 |
2.2 / 2.2 |
2.3 / 2.1 |
9 |
strong upwind |
23.1 / 27.4 |
19.9 / 52.3 |
22.1 / 27.8 |
3.2 / 8.3 |
2.0 / 2.6 |
10 |
strong upwind |
23.1 / 27.2 |
19.9 / 50.0 |
22.1 / 27.9 |
3.1 / 7.7 |
2.0 / 2.5 |
In the eight cases other than strong upwind (light winds, and cross winds in cases 3 to
6), this package is about as close to the measurements as the authors’ model: 1.8 to 2.4 dB per band on average at 535 m, 2.1 to 2.7 dB at 845
m, against their 1.6 to 2.2 and 2.2 to 3.2 dB; the spread of the measurements over the
five minutes is 1 to 3 dB. From 80 to 160 Hz this package loses more than was
measured at 845 m, 2.6 to 6.0 dB on average over those bands (at 535 m from 0.1 dB
less to 4.3 dB more), which puts its overall loss at 845 m 0.9 to 2.5 dB above the
measured one. With the
same inputs the authors’ model loses 3.4 to 5.1 dB less than this package in those
bands at the two distances, from 4.3 dB less to 1.3 dB more than was measured. This
package’s parabolic
equation matches the exact solution in still air from the hub within 0.1 dB from
535 m (see Ground reflection); what
parts the two models there is not traced. These winds bend
the sound little over these distances: in still air (--still) the overall losses
move by 1.1 dB at most and the mean differences by 0.4 dB at most, except downwind at
845 m in cases 1 and 2, which still air matches better (1.4 and 1.8 dB): there the wind
takes 1 to 3 dB more than still air from 100 to 160 Hz and up to 2 dB less at 250 Hz,
as the dip of the ground moves down in frequency when the sound comes in steeper. The field is flat and smooth,
as the authors modelled it, so its material scatters nothing: with the few late rays
that get this far, random scattering would only add noise.
Cases 9 and 10 are strong upwind. The published model puts 845 m deep in a shadow, 50 dB overall where 27 dB was measured, and the authors put the gap down to turbulence, which scatters sound into a shadow and which neither model has. Here the engine’s rays in the same profile still reach the microphones’ height at 845 m from the two upper sources: in case 9 they reach it up to 690 m from the source 71 m up, but up to 980 and 1230 m from those 119 and 167 m up (the script prints this for every case with a shadow), so only the lowest one is in shadow there, and the loss stays within about 1 dB of the measured one overall.
The data gives no measure of the eddies. With --turbulence moderate the overall losses
drop by up to 0.4 dB at 845 m and 0.2 dB at 535 m, as the eddies fill the ground dip a
little; the mean differences move by 0.3 dB at most, better at 845 m in the nine other
cases and 0.2 dB worse in case 8. In cases 9 and 10 the overall loss at 845 m comes to
27.4 and 27.5 dB, against 27.4 and 27.2 measured.
Turbulence against a parabolic equation through random eddies
validation/turbulence.py marches the engine’s own parabolic equation (checked against
the exact solution, see
Ground reflection) through random
eddies and averages its sound’s energy over 16 of them (Gilbert, Raspet and Di 1990):
each is a field of the index of refraction drawn with the von Kármán spectrum, outer
scale 10 m, in the vertical plane through the source and the listener. Both checks
fitted constants of the engine, so they show how well those fits hold over the cases
rather than test it independently.
The ground dip. In still air with the strong eddies, the level of the direct sound
and its reflection off the ground, 50, 100, 200 and 400 m away at 13 frequencies from
125 Hz to 2 kHz, against the parabolic equation’s: the engine’s coherence factor, and the
Markov approximation’s alone (Clifford and Lataitis 1983), which fills the dip over soft
grounds far more than the parabolic equation does. Mean (largest) absolute difference,
in dB:
ground |
source / listener (m) |
engine |
Markov alone |
|---|---|---|---|
grass |
2 / 1.5 |
0.75 (3.2) |
2.57 (13.6) |
grass |
5 / 1.5 |
0.64 (3.8) |
1.61 (7.1) |
loose soil |
1 / 1 |
1.29 (4.6) |
3.55 (14.1) |
gravel |
2 / 1.5 |
1.27 (7.0) |
2.06 (11.7) |
grass |
10 / 2 |
0.58 (2.1) |
0.93 (5.8) |
asphalt |
10 / 2 |
0.92 (3.5) |
0.86 (3.7) |
asphalt |
5 / 1.5 |
0.93 (7.2) |
0.91 (7.7) |
compacted soil |
3 / 3 |
0.75 (3.5) |
1.49 (7.8) |
Over the four soft grounds (grass and loose soil) the engine is 0.8 dB off on average, against 2.2 for the Markov approximation alone; over the four harder ones (compacted soil, gravel and asphalt) 1.0 against 1.3.
Into a shadow. Over grass, the source 2 m and the listener 1.5 m up, on a sunny day
and upwind in the windy preset, deep in the shadow (2.5 to 9 times as far as it
starts), from 250 Hz to 2 kHz: the parabolic equation’s level through the eddies against
the engine’s, which is the parabolic equation’s in still air plus what the eddies
scatter into the shadow. Mean (largest) absolute difference:
atmosphere |
shadow from |
|
|
|---|---|---|---|
sunny day |
56 m |
0.8 dB (2.9) |
1.2 dB (3.5) |
windy, upwind |
31 m |
0.7 dB (2.8) |
0.9 dB (2.5) |
The farthest points with moderate eddies, in dB over the free field:
Hz |
sunny day 503 m, still air |
through eddies |
engine |
windy 281 m, still air |
through eddies |
engine |
|---|---|---|---|---|---|---|
250 |
-33.3 |
-27.1 |
-25.9 |
-25.8 |
-25.7 |
-24.8 |
500 |
-49.2 |
-20.4 |
-21.8 |
-61.1 |
-26.3 |
-24.8 |
1000 |
-68.2 |
-13.4 |
-14.1 |
-64.9 |
-24.3 |
-21.5 |
2000 |
-61.9 |
-11.0 |
-11.6 |
-58.4 |
-19.7 |
-21.1 |
At these points, without the eddies the shadow sinks 49 to 68 dB below the free field from 500 Hz; through them it stays 11 to 26 dB below, and the engine follows within 3 dB. Only these heights and these two profiles were checked.
Eddies weaker with height. --profile runs both checks with the structure
parameters given 2 m up (height_m, see Turbulence) and
falling as z^(-2/3): each field is scaled in height by the square root of that, rising
right down to the roughness length 5 cm above the ground, where it is 12 times as
strong as at 2 m, while the engine takes Cn² no nearer the ground than the eddies’
outer scale, 10 m (0.34 of the value at 2 m). The ground dip, mean (largest) absolute
difference in dB, with a third column for the engine taking Cn² at each pair’s mean
height right down to the ground instead:
ground |
source / listener (m) |
engine |
Markov alone |
engine, Cn² down to the ground |
|---|---|---|---|---|
grass |
2 / 1.5 |
1.26 (8.0) |
2.56 (12.2) |
2.34 (9.9) |
grass |
5 / 1.5 |
0.89 (5.9) |
1.38 (6.4) |
1.15 (6.1) |
loose soil |
1 / 1 |
0.90 (4.9) |
3.18 (14.3) |
2.50 (9.1) |
gravel |
2 / 1.5 |
1.79 (8.3) |
2.16 (9.4) |
2.49 (10.5) |
grass |
10 / 2 |
0.71 (4.2) |
0.81 (3.8) |
0.62 (2.9) |
asphalt |
10 / 2 |
1.58 (11.3) |
1.38 (8.7) |
1.17 (9.2) |
asphalt |
5 / 1.5 |
1.60 (10.3) |
1.52 (8.6) |
1.45 (7.0) |
compacted soil |
3 / 3 |
1.10 (4.0) |
1.48 (8.0) |
1.37 (6.7) |
Over the four soft grounds the engine is 0.9 dB off on average (0.8 with eddies the same at every height, 1.7 taking Cn² down to the ground), over the four harder ones 1.5 (1.0 and 1.6). Taking Cn² right down to the ground puts the engine further off over the soft grounds and no nearer over the harder ones, so the engine keeps the outer scale, one rule for the coherence, the scattering and the shaking alike. Into the shadows, with the same profile:
atmosphere |
shadow from |
|
|
|---|---|---|---|
sunny day |
56 m |
1.3 dB (4.2) |
1.7 dB (5.8) |
windy, upwind |
31 m |
1.9 dB (8.7) |
2.9 dB (12.2) |
Deep in the shadow the eddies that scatter and shake sound in are those over the
limiting rays, tens of metres up, where the profile leaves a third to a seventh of the
strength at 2 m: the parabolic equation’s level through these eddies is 6 to 10 dB
(sunny day) and 4 to 7 dB (upwind) below that through eddies the same at every height
at the farthest points from 500 Hz, and the engine follows within 1.3 to 2.9 dB on
average (2.8 to 3.3 with Cn² at the geometric mean of the source’s and the listener’s
heights right down to the ground). Its largest misses are at the nearest points upwind
at 2 kHz, where the field’s strong layer at the ground brings the parabolic equation
back within 4 dB of the free field with the strong eddies (11 with eddies the same at
every height) while the engine, stopping at the outer scale, stays 16 below: near the
shadow’s edge the shaking does feel the eddies right at the ground, and the engine is
low there.
Vegetation against a particle simulation
validation/vegetation.py checks the late rays through vegetation against a particle
simulation written apart from the engine, in numpy: a source in the middle of a box
200 m across whose walls absorb everything, a slab of plants from x = 10 to 40 m across
it, and three receivers, spheres 10 m in radius 50 m from the source, through the slab
(+x), beside it (+y) and behind the source (-x). The particles go straight to their
next scattering, drawn at the medium’s rate, and leave in a direction drawn from its
phase function. Both count the energy in the spheres by the length of track through
them, and as the engine’s rain does: next-event estimates from every scattering in
foliage, and from every scattering off stems the track the next leg would have through
each sphere, averaged over the turns. Each run also sends the same particles through
empty air, and the table gives its energy less that run’s plus the exact free field’s,
so the direct sound’s own randomness drops out. Energy over the free field’s at 50 m,
mean ± standard error of 16 runs of a million particles:
medium |
receiver |
reference, spheres |
engine, spheres |
reference, rain |
engine, rain |
|---|---|---|---|---|---|
none (exact 1.008) |
through |
1.008 ± 0.002 |
1.010 ± 0.002 |
- |
- |
none (exact 1.008) |
beside |
1.003 ± 0.003 |
1.011 ± 0.003 |
- |
- |
none (exact 1.008) |
behind |
1.009 ± 0.002 |
1.006 ± 0.002 |
- |
- |
isotropic |
through |
0.997 ± 0.002 |
0.996 ± 0.003 |
0.990 ± 0.002 |
0.988 ± 0.002 |
isotropic |
beside |
1.418 ± 0.002 |
1.420 ± 0.002 |
1.418 ± 0.000 |
1.418 ± 0.000 |
isotropic |
behind |
1.204 ± 0.002 |
1.203 ± 0.001 |
1.202 ± 0.000 |
1.202 ± 0.000 |
forward |
through |
0.737 ± 0.002 |
0.734 ± 0.003 |
0.730 ± 0.001 |
0.732 ± 0.002 |
forward |
beside |
1.103 ± 0.001 |
1.102 ± 0.001 |
1.098 ± 0.000 |
1.098 ± 0.000 |
forward |
behind |
1.030 ± 0.000 |
1.030 ± 0.000 |
1.030 ± 0.000 |
1.030 ± 0.000 |
stems |
through |
0.685 ± 0.003 |
0.682 ± 0.002 |
0.685 ± 0.002 |
0.682 ± 0.001 |
stems |
beside |
1.254 ± 0.001 |
1.253 ± 0.001 |
1.254 ± 0.001 |
1.254 ± 0.001 |
stems |
behind |
1.187 ± 0.001 |
1.185 ± 0.001 |
1.186 ± 0.000 |
1.185 ± 0.000 |
leaves |
through |
0.947 ± 0.003 |
0.950 ± 0.002 |
0.939 ± 0.002 |
0.943 ± 0.002 |
leaves |
beside |
1.529 ± 0.002 |
1.526 ± 0.002 |
1.528 ± 0.001 |
1.527 ± 0.001 |
leaves |
behind |
1.252 ± 0.001 |
1.253 ± 0.001 |
1.251 ± 0.000 |
1.252 ± 0.000 |
two bands, band 1 |
through |
0.994 ± 0.003 |
1.005 ± 0.004 |
0.988 ± 0.002 |
0.991 ± 0.003 |
two bands, band 1 |
beside |
1.418 ± 0.002 |
1.421 ± 0.002 |
1.417 ± 0.000 |
1.417 ± 0.000 |
two bands, band 1 |
behind |
1.203 ± 0.001 |
1.204 ± 0.002 |
1.202 ± 0.000 |
1.202 ± 0.000 |
two bands, band 2 |
through |
0.736 ± 0.002 |
0.743 ± 0.003 |
0.732 ± 0.001 |
0.734 ± 0.003 |
two bands, band 2 |
beside |
1.101 ± 0.001 |
1.103 ± 0.001 |
1.098 ± 0.000 |
1.098 ± 0.000 |
two bands, band 2 |
behind |
1.030 ± 0.000 |
1.030 ± 0.000 |
1.030 ± 0.000 |
1.030 ± 0.000 |
The five media: foliage that scatters every way alike, 0.03 per metre; foliage that scatters forwards (mean cosine 0.6), 0.02 per metre, and absorbs 0.01; stems, 0.03 per metre of horizontal travel, turning sound by a mean cosine of -0.3; leaves of 0.25 m² per m³, 5 cm wide, as the engine works them out in the 4 kHz band (Leaves: 0.0535 per metre scattered with a mean cosine of 0.14, 0.00075 absorbed); and the first two in two bands at once, which the engine traces with one set of rays. The engine agrees with the particles within 1.1 % through the slab (0.4 % with one medium alone) and 0.3 % beside it and behind the source, with the spheres and with the rain: at most two to three of their standard errors, and the particles’ own runs differ as much from one set of seeds to another (0.990 and 0.988 through the slab, rain, the same foliage alone and in two bands). In empty air the two differ by 0.7 % beside the slab (1.003 and 1.011), each within 0.5 % of the exact 1.008: the runs’ own noise. Next to the slab the rain gives a little less than the spheres in both programs alike (the same with stems), as it takes the scattered sound at the sphere’s centre and the spheres its mean over the sphere. Beside and behind the slab the rain is steadier than the spheres. Only a slab was checked, and against a simulation of the same model, not against measurements through trees.
Leaves against closed forms and ISO 9613-2
validation/leaves.py checks foliage given as leaves (foliage: {leaf_area_per_m3, leaf_width}, see Vegetation), which the engine takes as thin
rigid discs turned every way alike. The disc’s scattering cross-section over its area
against its closed forms: small against the wavelength, the dipole of the air the
disc holds back, 16 (kr)⁴ / (81 π²) (from a disc’s added mass, 8 ρ r³ / 3, a third of
it turned every way alike); large, twice its mean projected area. In between the
engine bridges the two, as the exact cross-section of a disc about a wavelength
across is not in closed form:
kr |
0.1 |
0.3 |
1 |
2 |
3 |
5 |
10 |
30 |
|---|---|---|---|---|---|---|---|---|
dipole |
2.0e-6 |
1.6e-4 |
0.020 |
0.32 |
1.6 |
13 |
200 |
1.6e4 |
engine |
2.0e-6 |
1.6e-4 |
0.020 |
0.24 |
0.62 |
0.93 |
0.995 |
0.9999 |
mean cosine |
0 |
0 |
0.01 |
0.12 |
0.31 |
0.46 |
0.50 |
0.50 |
The leaves’ absorption, the viscous and thermal boundary layers on their two faces, matches a rigid wall’s in closed form (Morse and Ingard 1968, 6.4) to 1e-12: 3.6e-4 of a leaf’s area at 63 Hz, 1.5e-3 at 1 kHz, 4.1e-3 at 8 kHz, as the square root of the frequency.
Then a wood of leaves 50 m deep over a ground that absorbs everything, the source and listeners 1.5 m up, the listeners 5, 20 and 50 m behind it: the wood’s insertion loss (the level without it less the level with it, from two runs of the early paths and 10 million late rays per band, the mean of three seeds; the last row of each case is the largest spread between the seeds behind the wood), compared with ISO 9613-2’s dense-foliage attenuation for 50 m of foliage (Annex A, its rates per metre for 20 to 200 m), and with what the early paths alone lose (the leaves’ extinction):
leaves |
63 |
125 |
250 |
500 |
1k |
2k |
4k |
8k |
|
|---|---|---|---|---|---|---|---|---|---|
ISO 9613-2, dense foliage |
1.00 |
1.50 |
2.00 |
2.50 |
3.00 |
4.00 |
4.50 |
6.00 |
dB |
0.1 m²/m³, 5 cm wide |
0.01 |
0.01 |
0.02 |
0.02 |
0.06 |
0.45 |
4.66 |
16.49 |
early paths’ loss |
0.01 |
0.01 |
0.02 |
0.02 |
0.05 |
0.32 |
2.95 |
8.58 |
5 m behind |
|
0.01 |
0.01 |
0.02 |
0.02 |
0.05 |
0.36 |
3.46 |
10.23 |
50 m behind |
|
0.00 |
0.00 |
0.00 |
0.00 |
0.00 |
0.00 |
0.02 |
0.08 |
spread over seeds |
|
0.25 m²/m³, 5 cm wide |
0.02 |
0.03 |
0.04 |
0.06 |
0.14 |
1.11 |
11.65 |
41.22 |
early paths’ loss |
0.02 |
0.03 |
0.04 |
0.06 |
0.12 |
0.79 |
6.96 |
17.37 |
5 m behind |
|
0.02 |
0.03 |
0.04 |
0.06 |
0.13 |
0.89 |
8.20 |
20.41 |
50 m behind |
|
0.00 |
0.00 |
0.00 |
0.00 |
0.00 |
0.00 |
0.07 |
0.17 |
spread over seeds |
|
0.5 m²/m³, 5 cm wide |
0.04 |
0.06 |
0.08 |
0.12 |
0.29 |
2.23 |
23.30 |
82.45 |
early paths’ loss |
0.04 |
0.06 |
0.08 |
0.12 |
0.25 |
1.57 |
12.60 |
26.83 |
5 m behind |
|
0.04 |
0.06 |
0.08 |
0.12 |
0.26 |
1.78 |
14.75 |
30.69 |
50 m behind |
|
0.00 |
0.00 |
0.00 |
0.00 |
0.00 |
0.01 |
0.13 |
0.95 |
spread over seeds |
|
1 m²/m³, 5 cm wide |
0.08 |
0.11 |
0.16 |
0.24 |
0.57 |
4.45 |
46.61 |
164.90 |
early paths’ loss |
0.08 |
0.11 |
0.16 |
0.23 |
0.49 |
3.13 |
20.44 |
40.50 |
5 m behind |
|
0.08 |
0.11 |
0.16 |
0.24 |
0.52 |
3.54 |
23.47 |
44.39 |
50 m behind |
|
0.00 |
0.00 |
0.00 |
0.00 |
0.00 |
0.04 |
0.48 |
1.65 |
spread over seeds |
|
0.25 m²/m³, 2 cm wide |
0.02 |
0.03 |
0.04 |
0.06 |
0.08 |
0.14 |
0.58 |
5.92 |
early paths’ loss |
0.02 |
0.03 |
0.04 |
0.06 |
0.08 |
0.13 |
0.45 |
4.24 |
5 m behind |
|
0.02 |
0.03 |
0.04 |
0.06 |
0.08 |
0.13 |
0.49 |
4.79 |
50 m behind |
|
0.00 |
0.00 |
0.00 |
0.00 |
0.00 |
0.00 |
0.00 |
0.02 |
spread over seeds |
|
0.25 m²/m³, 10 cm wide |
0.02 |
0.03 |
0.04 |
0.12 |
1.08 |
11.61 |
41.16 |
53.29 |
early paths’ loss |
0.02 |
0.03 |
0.04 |
0.10 |
0.75 |
6.72 |
15.00 |
18.64 |
5 m behind |
|
0.02 |
0.03 |
0.04 |
0.11 |
0.86 |
7.97 |
18.03 |
21.81 |
50 m behind |
|
0.00 |
0.00 |
0.00 |
0.00 |
0.00 |
0.03 |
0.27 |
0.59 |
spread over seeds |
The standard’s table is empirical, for the foliage of whole woods, so this compares
magnitudes rather than checking against an exact answer. Leaves 5 cm wide at 0.1 m² per
m³, about a wood’s trunk space with some foliage in it, take about what the table gives
at 4 kHz (3.0 to 3.5 dB against 4.5) and more at 8 kHz (8.6 to 10.2 against 6); below 1
kHz they take next to nothing, where the table’s 1 to 2.5 dB are the standard’s
allowance for the whole wood, not what leaves scatter. The loss rises far more steeply
with frequency than the table, and with the leaves’ area and width, as measurements in
dense foliage do (Aylor 1972 measured the loss through reeds and corn rising by several
decibels per octave above 500 Hz): a leaf scatters once its size nears the wavelength,
so wider leaves take hold at lower frequencies, and leaves 2 cm wide hardly matter below
8 kHz. What the leaves scatter comes back as late sound, so a listener loses far less
than the early paths do (the extinction row): with 1 m² per m³ the early paths lose 165
dB at 8 kHz and the listener 40 to 44, the rest arriving scattered. Behind dense leaves
at 4 and 8 kHz what arrives is the rare ray that slips through, so the level takes many
rays to settle: with 100,000 rays (--rays 100000) it swings by up to 22 dB from one
seed to another at 8 kHz, with 10 million the seeds agree within 1.7 dB. No measurement
of a known leaf area and width was available to check against; the bridge between the
disc’s two limits, the discs standing in for real leaves, which flex and hang in clumps,
and the single phase function per band are the model’s assumptions.
The wave solver in wind and temperature against a parabolic equation
validation/wave_outdoor.py checks the wave solver’s speed of sound per cell against
the engine’s parabolic equation (itself within 0.2 dB of the exact solution over grass
in still air from a source 1 m up, see above), marched in
the vertical plane through the source and the listener with the effective speed of
sound along it. Both take the same profiles; the wave solver steps the scene in three
dimensions. Over grass (Miki’s impedance, 200 kPa s/m²), the source 2 m up, the
listeners 1.5 and 5 m up, 50 to 200 m away: the 63 Hz band from a grid for that band
(8 points per wavelength, 28.6 to 30.2 million cells), the 125 Hz band from one for it
(38.1 to 44.0 million cells), up to 100 m. The ground reaches three times the
half-width of the reflection’s first Fresnel zone at the farthest listener to either
side, 20 m behind the source, and 63 m (63 Hz) or 60 m (125 Hz) past the farthest
listener: far enough that the sound off its far end, which runs there and back, comes
after the end of the run at every listener, even at 350 m/s (the run lasts the farthest
distance over 330 m/s, plus 0.3 s). Levels in dB over the free field, the mean square
of the pressure over the band’s slices, wave solver / parabolic equation:
63 Hz |
50 m, 1.5 m up |
50 m, 5 m up |
100 m, 1.5 m up |
100 m, 5 m up |
200 m, 1.5 m up |
200 m, 5 m up |
|---|---|---|---|---|---|---|
still |
+5.3 / +5.2 |
+4.4 / +4.4 |
+5.2 / +5.2 |
+4.4 / +4.4 |
+5.0 / +5.0 |
+4.0 / +4.1 |
downwind |
+5.7 / +5.7 |
+4.3 / +4.4 |
+6.3 / +6.3 |
+4.7 / +4.9 |
+7.1 / +7.2 |
+5.1 / +5.4 |
upwind |
+4.8 / +4.6 |
+4.5 / +4.3 |
+3.9 / +3.8 |
+3.8 / +3.4 |
+2.0 / +1.8 |
+2.0 / +1.6 |
sunny day |
+5.1 / +5.1 |
+4.4 / +4.4 |
+4.8 / +4.8 |
+4.2 / +4.1 |
+3.9 / +4.0 |
+3.3 / +3.3 |
clear night |
+5.5 / +5.4 |
+4.5 / +4.4 |
+5.6 / +5.6 |
+4.6 / +4.6 |
+5.8 / +5.8 |
+4.6 / +4.6 |
125 Hz |
50 m, 1.5 m up |
50 m, 5 m up |
100 m, 1.5 m up |
100 m, 5 m up |
|---|---|---|---|---|
still |
+3.0 / +2.8 |
+1.0 / +0.8 |
+2.2 / +1.9 |
+0.5 / +0.3 |
downwind |
+3.1 / +3.3 |
-0.3 / -0.2 |
+2.8 / +2.9 |
-0.9 / -0.9 |
upwind |
+2.6 / +2.1 |
+1.8 / +1.4 |
+0.7 / +0.1 |
+0.9 / +0.4 |
sunny day |
+2.8 / +2.6 |
+1.2 / +1.0 |
+1.7 / +1.4 |
+0.7 / +0.4 |
clear night |
+3.2 / +3.0 |
+0.8 / +0.5 |
+2.5 / +2.3 |
+0.3 / +0.0 |
The weathers are the presets: downwind and upwind in the windy one (5 m/s 10 m up),
sunny_day and clear_night. The wave solver is within 0.60 dB of the parabolic
equation everywhere, 0.10 dB on average at 63 Hz and 0.25 dB at 125 Hz, and follows
the weather as it does: 2 dB louder downwind than in still air at 200 m and 1.5 m up,
3 dB quieter upwind (1.1 and 2.1 dB 5 m up). It reads above the parabolic equation
more often than below. In still air, against the
exact solution over grass, it is
−0.01 to +0.10 dB from it at 63 Hz and 0.16 to 0.20 dB over it at 125 Hz, the
parabolic equation within 0.05 dB. Part of that is sound off the sides of the scene’s
ground and off its end behind the source, which reaches the listeners within the run
and which neither the exact solution nor the parabolic equation has. In one-off checks
with every edge too far for its sound to come within the response (63 Hz: 160 m to
either side, 60 m behind, 150 m past, the response cut 300 ms after the direct sound;
125 Hz: 60 m to either side, 50 m behind, the response cut 130 ms after it), the wave
solver is 0.03 to 0.07 dB over the exact solution at 63 Hz and 0.09 to 0.13 dB at
125 Hz. Upwind the wave solver reads 0.14 to 0.39 dB above the parabolic equation at
63 Hz and 0.41 to 0.60 dB at 125 Hz, which was not traced further.
Neither the deep shadow upwind (it
starts a few hundred metres away at these heights) nor reflections off buildings, where
the effective speed of sound along the horizontal from the source stands in for the
flow, were checked (moving air is, below).
Moving air in the wave solver
validation/wave_wind.py checks the wave solver’s moving air (simulation.wave.wind: moving, see How the simulation bends sound)
against exact solutions, and the effective speed of sound beside it, in the 63 Hz band
(40 to 90 Hz, its edges a third of an octave wide) from a grid for that band; and the
wind it makes flow round the model’s solids against an ideal fluid’s.
Free field in a uniform wind. A wind of 15 m/s over a rigid ground, the source 2 m up, listeners 1.5 m up 30 m away downwind, upwind, across the wind and at 45 degrees to it. In a uniform wind each path (the direct sound and the ground’s image) is the convected Green’s function, an impulse of height 1 / R* at (R* - M x) / (c (1 - M²)), R* = √(x² + (1 - M²)(y² + z²)), x along the wind. The grid’s own dispersion puts the still air’s sound 0.61 ms late along the grid’s axes at 30 m (0.15 ms at 45 degrees), its level within 0.01 dB of the exact one along them and 0.25 dB over it at 45 degrees (the 7-point stencil’s own gain along a face’s diagonal, see Free field), and is the same with and without wind, so each windy run is compared with the still air’s run on the same grid, moved by the exact change of its arrival and scaled by R / R*. Level and arrival over the arrival (30 ms before to 50 ms after), and the waveform’s error:
15 m/s, 30 m |
downwind |
upwind |
across |
45 degrees |
|---|---|---|---|---|
level, effective / moving (dB) |
-0.78 / +0.00 |
+0.84 / -0.00 |
-0.14 / +0.00 |
-0.63 / -0.01 |
arrival, effective / moving (ms) |
-0.03 / -0.07 |
+0.03 / +0.09 |
-0.15 / +0.00 |
-0.03 / +0.00 |
waveform’s error, effective / moving (dB) |
-20.9 / -30.1 |
-19.6 / -28.0 |
-23.6 / -65.5 |
-22.9 / -45.1 |
Moving air is within 0.02 dB and 0.1 ms of the exact solution in every direction. The effective speed of sound gets the arrival about right but not the level, up to 0.84 dB off: a speed of sound that changes with the bearing is not a moving medium.
The wind round a dome. Where the atmosphere’s wind meets a surface of the model, moving air first makes it flow round the solids (see How the simulation bends sound). A rigid half sphere of 4 m radius on rigid ground in a uniform wind of 15 m/s: the wind of the run’s own solver, on the faces between its cells over the ground, against the flow of an ideal fluid past a sphere, the gradient of U (x + a³ x / (2 r³)), which the ground, a plane of symmetry, leaves as it is. The difference across each face in per cent of the wind, its root mean square and (in brackets) its largest:
distance from the dome’s centre |
63 Hz band’s grid (cells of 38 cm) |
125 Hz band’s grid (19 cm) |
|---|---|---|
within two cells of the dome |
8.8 % (58.6 %) |
9.2 % (150 %) |
from there to 1.5 radii |
1.5 % (8.3 %) |
0.88 % (9.7 %) |
1.5 to 2 radii |
0.59 % (2.9 %) |
0.37 % (1.6 %) |
2 to 3 radii |
0.35 % (1.6 %) |
0.32 % (1.0 %) |
beyond 3 radii |
0.28 % (2.1 %) |
0.29 % (2.2 %) |
Next to the dome the grid’s cells make a staircase of it, and the wind is fast round each of its corners: the fastest wind on the grid is 1.55 and 1.64 times the given one, where the ideal fluid’s is 1.5 times, over the top. From two cells off the surface the wind is the ideal fluid’s to 1.5 % and 0.9 %, and less farther out. Beyond 3 radii the difference no longer falls with the cell: the grid ends 4 radii from the centre along the ground and 3.5 radii up, and the wind’s correction with it (a one-off run with the ground 7 radii away and the sky 6.5 gives 0.06 % there and 0.17 % from 2 to 3 radii).
A façade downwind. A rigid building 40 m downwind of the source, its façade across the wind, 30 m high and 50 m wide, and a listener 10 m upwind of the source, both 2 m up: the façade sends the sound back against the wind. In a uniform wind of 15 m/s ray theory gives its arrival (a ray goes at c n + v for its wave normal n; off the façade the wave keeps its frequency and its wavenumber along the façade), 1.78 ms later than in still air. Moving air’s wind is not uniform there: it slows towards the façade and flows round the building, 13.9 m/s at the listener, 13.2 m/s at the source, 2.8 m/s 5 m before the façade and up to 49.5 m/s past the building’s edges. Its reference is the time along the still air’s paths through the wind the run’s solver made, each piece of a path at the speed of a ray along it, v · s + √(c² − |v|² + (v · s)²) (bending the paths changes the time only to the second order; the same sum through the uniform wind gives its exact rays’ arrival to within 0.001 ms). Against the still air’s run on the same grid:
Façade echo |
later than in still air |
off by |
|---|---|---|
ray theory, the uniform wind |
+1.78 ms |
|
effective speed of sound |
-8.81 ms |
-10.59 ms |
ray theory, the wind round the building |
+1.38 ms |
|
moving air |
+1.39 ms |
+0.01 ms |
The effective speed of sound sends the echo back at the speed of sound going away from the source: over its 40 m back to the source that makes it 80 v / (c² − v²) = 10.2 ms too soon, and the run gives 10.6 ms. The 0.4 ms between the two is not fully traced: the effective run’s grid steps for the fastest sound, c + v, and the still air’s for c, so the two disperse differently, which accounts for part of it. Moving air gets the echo 0.01 ms off the rays through its own wind, 0.39 ms sooner than a uniform wind would bring it: before the façade the air is nearly still. That wind is an ideal fluid’s, without the wake and the eddies of a real building’s, and at the building’s edges it is 3.3 times the given wind on this grid, where a real wind separates (see What is not modelled yet).
A wind that grows with height. The windy preset (5 m/s 10 m up, logarithmic) over
grass, downwind and upwind, the scene of the check above,
against the parabolic equation with the effective speed of sound, which holds at
these grazing angles. Levels in dB over the free field, wave solver / parabolic
equation:
63 Hz |
50 m, 1.5 m up |
50 m, 5 m up |
100 m, 1.5 m up |
100 m, 5 m up |
200 m, 1.5 m up |
200 m, 5 m up |
|---|---|---|---|---|---|---|
downwind, parabolic equation |
+5.7 |
+4.4 |
+6.3 |
+4.9 |
+7.2 |
+5.4 |
downwind, effective |
+5.7 |
+4.3 |
+6.3 |
+4.7 |
+7.1 |
+5.1 |
downwind, moving |
+5.9 |
+4.5 |
+6.5 |
+4.9 |
+7.4 |
+5.4 |
upwind, parabolic equation |
+4.6 |
+4.3 |
+3.8 |
+3.4 |
+1.8 |
+1.6 |
upwind, effective |
+4.8 |
+4.5 |
+3.9 |
+3.8 |
+2.0 |
+2.0 |
upwind, moving |
+4.6 |
+4.3 |
+3.7 |
+3.6 |
+1.9 |
+1.6 |
Moving air is within 0.26 dB of the parabolic equation, 0.09 dB on average; the effective speed of sound within 0.39 dB, 0.19 dB on average. Downwind the effective speed of sound is 0.02 to 0.29 dB below it and moving air −0.01 to +0.26 dB from it (most at 200 m, 1.5 m up); upwind moving air is within 0.13 dB and the effective speed of sound 0.14 to 0.39 dB above.
Moving air takes 3.9 to 4.9 times as long as the effective speed of sound where its wind is carried as given: 15 s against 3.7 s in the free field (3.2 million cells) and, with the preset (29.2 against 30.2 million cells), 324 and 312 s against 66 and 69 s downwind and upwind. Round the façade’s building it takes 12 times as long for the façade’s response of 0.45 s, 92 s against 7.6 s (6 million cells): 37 s to make the wind flow round the building (962 sweeps of its solve), which a run does once whatever its length, and its steps 8.3 times the effective speed of sound’s. On 4 cores with nothing else running (11 November 2026); run twice more, the façade’s case took 94 and 89 s with moving air and 7.9 and 6.9 s with the effective speed of sound.
A room with an opening. A wind blown through a room’s walls makes the solver’s sound grow there without bound (the scheme keeps the sound’s energy only where no wind crosses a surface); made to flow round them, it leaves the room sheltered. A rigid room on rigid ground, 4 × 4 × 3 m inside, its walls and roof 0.8 m thick, with an opening of 0.8 × 0.8 m in its wall downwind, the source and a listener in it, a response of 3 s in the 63 Hz band:
wind (m/s) |
fastest wind round the room (m/s) |
fastest wind in the room (m/s) |
moving air: listener’s level, last quarter second over the second (dB) |
the same with the effective speed of sound (dB) |
|---|---|---|---|---|
5 |
7.8 |
0.01 |
-0.5 |
-0.4 |
15 |
23.6 |
0.03 |
-0.8 |
-0.2 |
30 |
46.9 |
0.05 |
-1.1 |
-0.1 |
Nothing takes the room’s sound in but the opening, with either way of taking the wind. The solver still watches each run in moving air: from the end of the source’s pulse on, the pressure squared over the grid’s air, averaged over pieces of at least a quarter second, may not rise to twice its lowest level so far, or the run stops with an error (a rise that stays under a millionth of the run’s largest piece is let be). None of these runs is stopped.
One-off checks of the solver alone, on the 63 Hz band’s grid with rigid surfaces over 10 s at 15 m/s, the levels those of the grid’s last quarter second under its first: the same room loses 1.1 dB with its opening downwind (1.1 and 1.2 dB at 5 and 30 m/s) and 1.1 dB with it upwind. In the open, a yard closed on four sides (4 × 4 m, walls 4 m high), a street 3 m wide between two buildings 5 m high, a façade downwind of the source and one upwind of it die away steadily, by 68, 73, 131 and 131 dB.
The border of the moving air. The air of the grid’s absorbing layer is still, and
the wind crosses the border between the two. Through each face of that border the
cell’s own sound goes out with the wind and silence comes in, which takes energy from
the sound and adds none (see the notes of fdtd.hpp); carried with the layer’s own
values instead, the sound grows there in fast winds: in one-off runs over open ground
on a grid 4 m tall, the slowest wind in which it did was 53 m/s, at 45 degrees to the
grid. The tests hold a wind of 0.3 cells per time step along both axes over open
ground (178 m/s along each) and one of 0.3 along the grid past a block, round which it
gets to 0.45 (266 m/s): from 1,500 steps on, the sound over the grid stays more than
60 dB under its level over the first 500. In one-off runs of the solver alone on
cells of 25 cm, none of 39
runs (28 set-ups, some at several wind speeds) grows over 20,000 to 40,000 steps in
given winds of up to 0.45 cells per step (267 m/s): open ground with the wind along
the grid, at 15, 30, 45 and 60 degrees to it and rising with height, on grids 2.5 and
4 m tall; a block, one next to the downwind border, stairs, a barrier, walls with a
slit and with a hole, a pit, streets along and across the wind, and rooms with an
opening downwind, upwind and to the side. Those in the open fall by 106 to 189 dB
within their runs: 18 of the 30 until they stop falling, 181 to 189 dB down, and end
up to 9 dB above their lowest, 173 to 183 dB down; a run in almost still air on the
4 m grid (1e-7 cells per step) ends 171 dB down, 3 dB above its lowest, which makes
that single precision’s rounding and not the wind. The other 12 were still falling at
their end. The rooms lose 8 to 30 dB through their openings. More than 200 further
one-off runs of 3,000 to 16,000 steps (other directions and shapes of wind, other
proportions of the grid, solids one to three cells from the border) grow in none
either.
A wave that leaves the moving air for the layer’s still air comes back in part, by about half the wind’s Mach number, and so it does carried with the layer’s own values (a one-off run of this check then gives 34 to 42 dB at 10 m/s). The plate of the open model’s check in a uniform wind, 25 to 150 Hz on cells of 30 cm, with the default layer against a grid 45 cells larger all round, whose border sends nothing back in the 70 ms of the runs (their last 10 ms faded out): what differs at the three listeners, in dB relative to the sound itself,
wind (m/s) |
along the grid |
at 45 degrees to it |
half the Mach number |
|---|---|---|---|
0 |
−74.0, −78.0, −75.0 |
||
5 |
−39.7, −45.6, −44.2 |
−37.8, −45.5, −40.0 |
−42.7 |
10 |
−34.0, −39.8, −38.4 |
−32.0, −39.7, −34.2 |
−36.7 |
20 |
−28.4, −34.2, −32.9 |
−26.3, −34.0, −28.6 |
−30.7 |
40 |
−23.1, −28.8, −27.8 |
−21.0, −28.6, −23.2 |
−24.7 |
In still air the layer returns 74 to 78 dB less than the sound; in a uniform wind of
5 m/s, the windy preset’s 10 m up, 38 to 46 dB less. Taking that away needs a layer
made for moving air, which the solver does not have (see
What is not modelled yet).
Outdoor results against exact solutions
validation/insertion_loss.py runs whole outdoor scenes through the results an outdoor
run reports, the level relative to free field and the insertion loss (see
Outdoor scenes), and compares them with exact solutions.
The barrier’s scenes take the paths over its edge (simulation.early.rows: edges),
which those solutions are of; the solver for whole rows has its own check
(Rows of roofs and barriers against a wave calculation).
A thin barrier 3 m high, 10 m from a source 1 m up, with listeners 1.5 m up, 2 to 90 m behind it, over a ground that absorbs everything: its insertion loss, from the two runs, against the Biot-Tolstoy-Medwin solution for a half-plane (Edge diffraction), per octave band, and Maekawa’s chart for reference:
listener |
63 |
125 |
250 |
500 |
1k |
2k |
4k |
8k |
|
|---|---|---|---|---|---|---|---|---|---|
2 m behind |
8.84 |
11.08 |
13.67 |
16.49 |
19.43 |
22.42 |
25.43 |
28.44 |
exact, dB |
-0.01 |
+0.00 |
+0.01 |
+0.01 |
+0.01 |
+0.01 |
+0.02 |
+0.07 |
engine - exact |
|
+0.22 |
+0.06 |
-0.05 |
-0.15 |
-0.23 |
-0.29 |
-0.33 |
-0.35 |
Maekawa - exact |
|
10 m behind |
8.32 |
10.06 |
12.16 |
14.63 |
17.38 |
20.29 |
23.28 |
26.28 |
exact, dB |
-0.01 |
-0.00 |
+0.00 |
+0.00 |
+0.01 |
+0.01 |
+0.01 |
+0.03 |
engine - exact |
|
-1.14 |
-1.35 |
-1.43 |
-1.47 |
-1.54 |
-1.62 |
-1.68 |
-1.71 |
Maekawa - exact |
|
40 m behind |
8.16 |
9.69 |
11.58 |
13.87 |
16.49 |
19.34 |
22.30 |
25.30 |
exact, dB |
-0.01 |
-0.00 |
+0.00 |
+0.00 |
+0.00 |
+0.01 |
+0.01 |
+0.03 |
engine - exact |
|
-1.49 |
-1.72 |
-1.80 |
-1.82 |
-1.86 |
-1.93 |
-2.00 |
-2.05 |
Maekawa - exact |
|
90 m behind |
8.12 |
9.61 |
11.46 |
13.70 |
16.30 |
19.13 |
22.08 |
25.08 |
exact, dB |
-0.00 |
-0.00 |
+0.00 |
+0.00 |
+0.00 |
+0.01 |
+0.01 |
+0.03 |
engine - exact |
|
-1.55 |
-1.79 |
-1.87 |
-1.88 |
-1.92 |
-1.99 |
-2.06 |
-2.11 |
Maekawa - exact |
The engine agrees within 0.07 dB. Maekawa’s chart is within 2.1 dB, giving less loss than the exact solution from 10 m behind the barrier.
The same barrier on a rigid ground, against the four paths over its top (the source
and its image in the ground, to the listener and its image), each by the exact
solution, and without the barrier the direct sound and its reflection, averaged over
each band. In the bands up to 500 Hz the engine reads the early paths through band
filters, whose skirts let in a little of the neighbouring bands where four paths
interfere, so the table also compares it with the exact solution read through the same
filters (through the filters; from 1 kHz up the engine averages each pair of paths’
interference over the band exactly, and the row repeats the one above it). First with
simulation.early.diffraction_reflections: both_sides, which takes all four paths:
listener |
63 |
125 |
250 |
500 |
1k |
2k |
4k |
8k |
|
|---|---|---|---|---|---|---|---|---|---|
2 m behind |
14.20 |
11.15 |
23.58 |
10.23 |
19.56 |
22.62 |
24.84 |
28.16 |
exact, dB |
-0.57 |
+0.23 |
-2.09 |
+0.37 |
+0.03 |
+0.01 |
+0.05 |
+0.14 |
engine - exact |
|
-0.02 |
-0.06 |
-0.05 |
-0.03 |
+0.03 |
+0.01 |
+0.05 |
+0.14 |
through the filters |
|
-0.00 |
+0.00 |
+0.00 |
+0.00 |
-0.00 |
-0.00 |
-0.00 |
-0.01 |
without the barrier |
|
10 m behind |
6.30 |
13.89 |
25.20 |
14.79 |
9.06 |
22.30 |
22.66 |
25.94 |
exact, dB |
+0.05 |
-0.04 |
-2.24 |
-0.06 |
+0.01 |
+0.00 |
+0.04 |
+0.07 |
engine - exact |
|
-0.04 |
-0.07 |
-0.04 |
-0.04 |
+0.01 |
+0.00 |
+0.04 |
+0.07 |
through the filters |
|
-0.00 |
+0.00 |
+0.00 |
+0.00 |
+0.00 |
-0.00 |
-0.00 |
-0.01 |
without the barrier |
|
40 m behind |
4.41 |
8.41 |
18.05 |
18.54 |
18.19 |
15.47 |
21.17 |
24.46 |
exact, dB |
+0.03 |
+0.08 |
-0.50 |
+0.19 |
-0.00 |
+0.00 |
+0.02 |
+0.06 |
engine - exact |
|
-0.04 |
-0.06 |
-0.06 |
-0.06 |
-0.00 |
+0.00 |
+0.02 |
+0.06 |
through the filters |
|
-0.00 |
+0.00 |
+0.00 |
+0.00 |
-0.00 |
-0.00 |
-0.00 |
-0.00 |
without the barrier |
|
90 m behind |
4.16 |
7.93 |
16.65 |
12.67 |
20.65 |
24.89 |
16.26 |
23.52 |
exact, dB |
+0.03 |
+0.08 |
-0.60 |
+0.25 |
+0.02 |
-0.01 |
+0.02 |
+0.07 |
engine - exact |
|
-0.03 |
-0.06 |
-0.06 |
-0.04 |
+0.02 |
-0.01 |
+0.02 |
+0.07 |
through the filters |
|
-0.00 |
+0.00 |
+0.00 |
+0.00 |
-0.00 |
-0.00 |
-0.00 |
-0.00 |
without the barrier |
Read alike, the engine is within 0.15 dB of the exact solution at every listener and band (0.07 dB up to 500 Hz, 0.14 dB at 8 kHz, 0.05 dB elsewhere), and without the barrier (the direct sound and its reflection, added in pressure) within 0.01 dB. The 2 dB at 250 Hz near the barrier is what the band filters let in from the bands beside a deep interference dip, as a measured response read through the same filters would show, not a gap in the model.
Then with the default one_side, where a path reflects before or after the edge but
not both, so the path reflected both before and after the barrier, a quarter of the
sound over it, is left out:
listener |
63 |
125 |
250 |
500 |
1k |
2k |
4k |
8k |
|
|---|---|---|---|---|---|---|---|---|---|
2 m behind |
-2.31 |
+1.46 |
-3.85 |
+0.88 |
+0.36 |
+0.30 |
+0.52 |
+0.53 |
engine - exact |
-1.76 |
+1.17 |
-1.81 |
+0.48 |
+0.36 |
+0.30 |
+0.52 |
+0.53 |
through the filters |
|
10 m behind |
+0.93 |
-1.65 |
-5.05 |
+0.87 |
+0.53 |
+0.43 |
+0.65 |
+0.54 |
engine - exact |
+0.83 |
-1.68 |
-2.85 |
+0.89 |
+0.53 |
+0.43 |
+0.65 |
+0.54 |
through the filters |
|
40 m behind |
+1.71 |
+0.72 |
-2.68 |
+1.78 |
+0.40 |
+0.26 |
+0.72 |
+0.62 |
engine - exact |
+1.64 |
+0.57 |
-2.25 |
+1.54 |
+0.40 |
+0.26 |
+0.72 |
+0.62 |
through the filters |
|
90 m behind |
+1.85 |
+1.06 |
-2.41 |
+1.74 |
-0.50 |
-0.75 |
+0.76 |
+0.68 |
engine - exact |
+1.79 |
+0.91 |
-1.88 |
+1.46 |
-0.50 |
-0.75 |
+0.76 |
+0.68 |
through the filters |
Without that path the insertion loss comes out 0.3 to 0.8 dB too high from 1 kHz up,
but for 1 and 2 kHz 90 m behind, where it is 0.5 and 0.8 dB too low; in the bands
below, where the four paths interfere, it is up to 3 dB off either way read through
the filters (5 dB against the exact band averages). Over grass and other soft grounds, whose
reflections near grazing are weaker, the path left out should carry less, but no
check here runs one_side over such a ground. The sound that goes over the top, down to the ground and over the top again
is left out of both.
A source 1 m over grass and nothing else, the listener 1.5 m up: the level relative to free field against the exact solution for a locally reacting ground (Ground reflection), averaged over each band:
distance |
63 |
125 |
250 |
500 |
1k |
2k |
4k |
8k |
|
|---|---|---|---|---|---|---|---|---|---|
10 m |
5.27 |
3.74 |
-1.23 |
-1.55 |
1.43 |
0.27 |
1.10 |
0.85 |
exact, dB |
-0.04 |
-0.11 |
-0.06 |
+0.44 |
-0.01 |
-0.00 |
-0.01 |
-0.01 |
engine - exact |
|
50 m |
5.52 |
3.58 |
-3.02 |
-11.16 |
-2.05 |
3.84 |
2.74 |
2.43 |
exact, dB |
-0.07 |
-0.15 |
-0.03 |
+0.85 |
+0.00 |
-0.00 |
-0.00 |
-0.00 |
engine - exact |
|
200 m |
5.31 |
1.10 |
-13.10 |
-22.37 |
-12.89 |
-5.56 |
0.52 |
4.91 |
exact, dB |
-0.15 |
-0.10 |
+0.87 |
+0.72 |
+0.00 |
+0.00 |
-0.00 |
-0.00 |
engine - exact |
From 1 kHz up the engine averages each pair of paths’ interference over the band exactly and agrees within 0.01 dB; in the bands up to 500 Hz it reads the early paths through band filters, whose skirts fill the ground dip by up to 0.87 dB (the ground’s own check above compares the band averages, without the filters). Both results are checked against theory, not against measurements of a barrier or a ground.
Outdoor sound in wind against a fast field program
validation/ffp.py is a fast field program for sound over a flat ground through a
layered atmosphere, the kind of model the benchmark cases for outdoor sound of
Attenborough and others (J. Acoust. Soc. Am. 97, 1995, 173-191) were solved with,
written apart from the engine to check its parabolic equation in wind and temperature.
It writes the sound field as an integral over the horizontal wavenumber and, for each
wavenumber, solves the vertical problem exactly through a stack of layers in each of
which the speed of sound is constant: the atmosphere as a staircase of layers a quarter
wavelength thick, 1 m at most, halving sixteen times towards the ground, the source,
the listener and the top; the ground an impedance boundary; and above the top, 1000 m
up, where the engine’s atmosphere stops changing, homogeneous air that sends nothing
back. The integral follows a contour dipped into the complex plane past the poles near
the real axis, with the Bessel function evaluated exactly rather than by its far-field
form, so the field is right at 100 m as at 10 km. Its Bessel functions are its own (a
power series up to an argument of 17 and the Hankel expansion beyond, 2 × 10⁻¹⁰ apart
where they meet and 2 × 10⁻⁸ off tabulated integrals), so the script needs nothing but
numpy.
In still air it is checked against the exact solution for a source over a locally reacting ground (Ground reflection), the source 5 m and the listener 1 m up, the level over the free field’s:
100 m |
300 m |
1 km |
3 km |
10 km |
||
|---|---|---|---|---|---|---|
10 Hz, rigid |
6.02 |
6.02 |
6.02 |
6.02 |
6.02 |
exact, dB |
0.000 |
0.000 |
0.000 |
0.000 |
0.000 |
ffp - exact |
|
10 Hz, grass |
6.04 |
6.12 |
6.26 |
6.43 |
6.51 |
exact, dB |
0.000 |
0.000 |
0.000 |
0.000 |
0.000 |
ffp - exact |
|
100 Hz, rigid |
5.98 |
6.02 |
6.02 |
6.02 |
6.02 |
exact, dB |
0.000 |
0.000 |
0.000 |
0.000 |
0.000 |
ffp - exact |
|
100 Hz, grass |
3.12 |
0.72 |
-7.95 |
-23.91 |
-35.29 |
exact, dB |
0.000 |
0.000 |
0.000 |
0.000 |
-0.001 |
ffp - exact |
|
1000 Hz, rigid |
1.72 |
5.61 |
5.98 |
6.02 |
6.02 |
exact, dB |
0.000 |
0.000 |
0.000 |
0.000 |
0.000 |
ffp - exact |
|
1000 Hz, grass |
1.30 |
-6.58 |
-16.61 |
-26.04 |
-36.46 |
exact, dB |
0.000 |
0.000 |
0.000 |
0.000 |
-0.001 |
ffp - exact |
It agrees to 0.001 dB from 10 Hz to 1 kHz and from 100 m to 10 km, over a rigid ground and over grass. With the speed of sound rising 0.1 m/s per metre of height, halving its layers changes the level by 0.006 dB at most (100 Hz and 1 kHz, 1 and 10 km out), so the staircase is converged. In a deep shadow its layers scatter a little sound: the field has a floor near -60 dB re free field, lower with thinner layers, so nothing is compared below -60 dB, where nothing is heard anyway. The tables below still print the program’s level there, down to -125 dB: those values are its floor, not the field.
validation/benchmark_1995.py runs the benchmark’s cases 1 to 3 through the program
and the engine: a source 5 m and a listener 1 m over a ground of flow resistivity
200 kPa s/m² (Delany and Bazley’s impedance), 100 m to 10 km apart, in still air
(case 1), with the speed of sound rising 0.1 m/s per metre of height (case 2, downward
refraction: downwind or under an inversion) and falling as much (case 3, upward
refraction: upwind or over sun-warmed ground). The benchmark’s gradients go on without
end; the engine’s atmosphere stops changing 1000 m up, 100 m/s off the ground’s speed,
and the program follows it there. Such a gradient over a kilometre of height is beyond
any weather, so two more cases stop it 100 m up, 10 m/s more or less than at the
ground, as a strong wind blows: the weather the engine is meant for. Case 4, case 3
with turbulence, is not run: the benchmark’s eddies have a Gaussian spectrum, the
engine’s a von Kármán one, checked in
Turbulence.
First the engine’s parabolic equations alone, at the benchmark’s pure tones: the
narrow-angle one (acoustic_spaces.engine.parabolic, the Green’s function parabolic
equation of Gilbert and Di, the default, which gives the engine’s sound over the open
ground in the bands up to 2 kHz) and the wide-angle one
(acoustic_spaces.engine.wide_angle, see
The wide-angle parabolic equation); the program’s
level re free field and each equation’s difference from it (-: deeper than -60 dB):
100 m |
200 m |
500 m |
1 km |
2 km |
5 km |
10 km |
||
|---|---|---|---|---|---|---|---|---|
case 1, still air, 10 Hz |
6.00 |
6.02 |
6.04 |
6.06 |
6.08 |
6.12 |
6.12 |
ffp, dB |
+0.04 |
+0.01 |
-0.03 |
-0.03 |
-0.04 |
-0.04 |
-0.01 |
narrow - ffp |
|
-0.02 |
-0.00 |
+0.00 |
+0.00 |
+0.00 |
-0.00 |
+0.03 |
wide - ffp |
|
case 1, still air, 100 Hz |
4.26 |
3.72 |
2.27 |
-0.11 |
-4.88 |
-16.72 |
-24.77 |
ffp, dB |
-0.03 |
-0.02 |
-0.00 |
+0.02 |
+0.02 |
-0.05 |
-0.10 |
narrow - ffp |
|
+0.00 |
+0.00 |
+0.00 |
+0.00 |
+0.00 |
-0.00 |
-0.04 |
wide - ffp |
|
case 1, still air, 1000 Hz |
0.72 |
-3.88 |
-11.14 |
-16.96 |
-22.88 |
-30.78 |
-36.78 |
ffp, dB |
-0.03 |
-0.04 |
-0.05 |
-0.05 |
-0.05 |
-0.05 |
-0.05 |
narrow - ffp |
|
-0.00 |
-0.00 |
-0.00 |
+0.00 |
-0.00 |
+0.00 |
+0.01 |
wide - ffp |
|
case 2, downward refraction 0.1/s, 10 Hz |
6.23 |
6.67 |
8.62 |
13.02 |
13.84 |
20.29 |
24.28 |
ffp, dB |
-0.20 |
-0.27 |
-0.38 |
-0.45 |
+0.14 |
-6.47 |
-2.10 |
narrow - ffp |
|
-0.02 |
-0.00 |
+0.00 |
+0.00 |
-0.01 |
-0.01 |
+0.03 |
wide - ffp |
|
case 2, downward refraction 0.1/s, 100 Hz |
4.60 |
4.84 |
5.51 |
2.81 |
8.72 |
3.92 |
11.89 |
ffp, dB |
-0.04 |
-0.04 |
-0.01 |
-0.03 |
-0.02 |
+5.52 |
-19.77 |
narrow - ffp |
|
+0.00 |
+0.00 |
-0.00 |
-0.00 |
-0.01 |
-0.02 |
-0.01 |
wide - ffp |
|
case 2, downward refraction 0.1/s, 1000 Hz |
2.13 |
1.71 |
8.30 |
9.25 |
5.31 |
-2.51 |
-10.13 |
ffp, dB |
-0.04 |
-0.04 |
-0.04 |
+0.32 |
-10.92 |
+3.40 |
-0.58 |
narrow - ffp |
|
-0.00 |
-0.00 |
-0.00 |
-0.00 |
-0.01 |
-0.05 |
-0.11 |
wide - ffp |
|
case 3, upward refraction 0.1/s, 10 Hz |
5.77 |
5.35 |
3.40 |
-1.29 |
-13.32 |
-41.23 |
-77.99 |
ffp, dB |
+0.28 |
+0.21 |
+0.21 |
+0.47 |
-0.06 |
-9.08 |
- |
narrow - ffp |
|
-0.02 |
-0.00 |
-0.00 |
-0.01 |
-0.01 |
+0.28 |
- |
wide - ffp |
|
case 3, upward refraction 0.1/s, 100 Hz |
3.88 |
2.40 |
-3.54 |
-16.07 |
-44.04 |
-64.00 |
-98.16 |
ffp, dB |
-0.02 |
-0.01 |
+0.01 |
+0.04 |
-0.12 |
- |
- |
narrow - ffp |
|
-0.00 |
-0.00 |
-0.01 |
-0.01 |
-0.05 |
- |
- |
wide - ffp |
|
case 3, upward refraction 0.1/s, 1000 Hz |
-1.08 |
-12.11 |
-52.50 |
-92.86 |
-98.39 |
-94.54 |
-121.03 |
ffp, dB |
-0.05 |
-0.04 |
+7.79 |
- |
- |
- |
- |
narrow - ffp |
|
-0.00 |
-0.00 |
-0.02 |
- |
- |
- |
- |
wide - ffp |
|
0.1/s up to 100 m, 10 Hz |
6.23 |
6.68 |
8.55 |
13.37 |
15.64 |
18.42 |
18.27 |
ffp, dB |
-0.20 |
-0.24 |
-0.33 |
-0.49 |
-0.34 |
-0.38 |
-0.49 |
narrow - ffp |
|
-0.02 |
-0.00 |
+0.00 |
+0.00 |
-0.00 |
-0.00 |
-0.01 |
wide - ffp |
|
0.1/s up to 100 m, 100 Hz |
4.60 |
4.84 |
5.51 |
2.80 |
-13.83 |
-2.11 |
-10.57 |
ffp, dB |
-0.04 |
-0.04 |
-0.02 |
+0.04 |
+3.22 |
-0.19 |
-3.12 |
narrow - ffp |
|
+0.00 |
+0.00 |
-0.00 |
-0.00 |
+0.02 |
-0.00 |
+0.00 |
wide - ffp |
|
0.1/s up to 100 m, 1000 Hz |
2.13 |
1.71 |
8.30 |
9.25 |
0.48 |
-21.83 |
-47.12 |
ffp, dB |
-0.04 |
-0.04 |
-0.04 |
+0.33 |
+1.23 |
-1.93 |
+11.32 |
narrow - ffp |
|
-0.00 |
-0.00 |
-0.00 |
-0.00 |
-0.00 |
-0.00 |
+0.02 |
wide - ffp |
|
-0.1/s up to 100 m, 10 Hz |
5.78 |
5.35 |
3.28 |
-0.47 |
-9.92 |
-44.43 |
-69.88 |
ffp, dB |
+0.28 |
+0.24 |
+0.32 |
+0.28 |
+0.22 |
+1.42 |
- |
narrow - ffp |
|
-0.02 |
-0.00 |
-0.00 |
-0.01 |
-0.01 |
-0.41 |
- |
wide - ffp |
|
-0.1/s up to 100 m, 100 Hz |
3.88 |
2.40 |
-3.53 |
-16.14 |
-45.75 |
-102.87 |
-98.15 |
ffp, dB |
-0.02 |
-0.01 |
-0.02 |
+0.10 |
-5.79 |
- |
- |
narrow - ffp |
|
-0.00 |
-0.00 |
-0.01 |
-0.02 |
+0.07 |
- |
- |
wide - ffp |
|
-0.1/s up to 100 m, 1000 Hz |
-1.08 |
-12.11 |
-52.51 |
-64.37 |
-98.31 |
-125.03 |
-121.03 |
ffp, dB |
-0.04 |
-0.05 |
+0.33 |
- |
- |
- |
- |
narrow - ffp |
|
-0.00 |
-0.00 |
-0.01 |
- |
- |
- |
- |
wide - ffp |
In still air the narrow-angle equation and the program agree within 0.05 dB to 5 km and 0.1 dB at 10 km. At 10 Hz, below the engine’s lowest band, the narrow-angle equation is up to 0.5 dB off in the refracting cases out to 2 km, and further out 0.5 dB downwind and 1.4 dB upwind with the gradient stopping at 100 m, 2 to 9 dB with the benchmark’s gradients. In wind the agreement holds as far as the sound reaches the listener at the flat angles a parabolic equation carries. With the gradient stopping 100 m up, which turns back only the sound within 14 degrees of the horizontal, the parabolic equation is within 0.05 dB at 100 Hz and 0.35 dB at 1 kHz up to 1 km downwind, 1 to 3 dB at 2 km, where the bent paths interfere and the two place a dip a little apart, within 2 dB at 5 km, and 3 dB at 10 km at 100 Hz (11 dB at 1 kHz, 47 dB down; the engine’s 1 kHz band comes from this equation there too, not compared as a band beyond 2 km). Upwind, in the shadow, it is within 0.1 dB at 100 Hz and 1 kHz until the sound is 20 dB down (0.33 dB at 1 kHz 500 m, 52 dB down) and strays by up to 6 dB deeper in (100 Hz, 2 km, 46 dB down; 1.4 dB at 10 Hz, 5 km, 44 dB down), below where the eddies keep a shadow in practice (see Turbulence). With the benchmark’s gradient going on to 1000 m, sound that has risen hundreds of metres comes back down at 17 degrees and more, and upwind the speed of sound a kilometre up is 100 m/s below the ground’s, an index of refraction of 1.4; the parabolic equation, a narrow-angle one that marches the field out along the ground and takes the refraction as a phase shift at each step, carries neither: downwind the two part beyond 1 km at 1 kHz and 2 km at 100 Hz, by 3 to 20 dB at a pure tone where several bent paths interfere, and upwind it comes out 8 dB too loud at 1 kHz 500 m into the shadow (0.3 dB with the gradient stopping at 100 m). Such profiles are beyond any weather; the engine’s atmosphere is meant for the gradients near the ground that make the shadows and the focusing in practice, and within a few kilometres of the source. The wide-angle equation carries both: within 0.05 dB of the program in every case, at every tone and to 10 km, wherever the sound is within 40 dB of free field, but for 0.11 dB at 1 kHz 10 km downwind; deeper in the shadow within 0.07 dB at 100 Hz and 1 kHz, and 0.3 to 0.4 dB at 10 Hz 5 km upwind, 41 to 44 dB down.
Then whole scenes, each case as an outdoor scene: the gradient as a measured
atmosphere (atmosphere.table) with the wind along the line of the listeners, the air
at 19.6 °C (343 m/s at the ground) and 50 % humidity, and the engine’s defaults
otherwise (the early paths as image sources up to one reflection, 50,000 late rays). The
level relative to free field the engine reports per octave band from 63 Hz to 1 kHz
(Outdoor scenes) against the program averaged over the
band as the engine reads it (eight frequencies per band; 24 at 1 kHz, as the parabolic
equation takes there, and in still air the rays average the paths’ interference
exactly), and in the bands up to 500 Hz also against the
program read through the engine’s band filters, as the barrier check above is (through
the filters). The engine’s rays carry the air’s absorption along their own paths and the
program runs without it, a difference of the path lengths only, under 0.01 dB here:
case 1, still air
distance |
63 |
125 |
250 |
500 |
1k |
|
|---|---|---|---|---|---|---|
100 m |
5.17 |
3.15 |
-2.31 |
-6.43 |
1.37 |
ffp, dB |
-0.05 |
-0.11 |
-0.03 |
+0.59 |
-0.00 |
engine - ffp |
|
+0.00 |
-0.01 |
-0.01 |
-0.00 |
-0.00 |
through the filters |
|
200 m |
5.01 |
2.07 |
-6.18 |
-11.08 |
-2.96 |
ffp, dB |
-0.08 |
-0.14 |
+0.17 |
+0.54 |
-0.00 |
engine - ffp |
|
-0.02 |
-0.01 |
+0.03 |
-0.03 |
-0.00 |
through the filters |
|
500 m |
4.58 |
-0.53 |
-14.60 |
-18.32 |
-10.16 |
ffp, dB |
-0.14 |
-0.04 |
+0.93 |
+0.44 |
-0.00 |
engine - ffp |
|
-0.04 |
+0.05 |
+0.16 |
-0.11 |
-0.00 |
through the filters |
|
1 km |
3.85 |
-3.98 |
-22.32 |
-24.12 |
-15.97 |
ffp, dB |
-0.15 |
+0.20 |
+1.47 |
+0.31 |
-0.00 |
engine - ffp |
|
-0.02 |
+0.12 |
+0.32 |
-0.23 |
-0.00 |
through the filters |
|
2 km |
2.41 |
-9.47 |
-28.84 |
-30.03 |
-21.90 |
ffp, dB |
-0.10 |
+0.81 |
+1.30 |
+0.11 |
-0.00 |
engine - ffp |
|
+0.04 |
+0.27 |
+0.53 |
-0.42 |
-0.00 |
through the filters |
case 2, downward refraction 0.1/s
distance |
63 |
125 |
250 |
500 |
1k |
|
|---|---|---|---|---|---|---|
100 m |
5.55 |
3.42 |
-2.27 |
-5.22 |
2.55 |
ffp, dB |
-0.05 |
-0.05 |
-0.04 |
-0.07 |
-0.04 |
engine - ffp |
|
+0.00 |
+0.06 |
-0.04 |
-0.68 |
-0.04 |
through the filters |
|
200 m |
6.21 |
2.97 |
-5.67 |
-6.00 |
2.28 |
ffp, dB |
-0.04 |
-0.04 |
-0.05 |
-0.07 |
-0.05 |
engine - ffp |
|
+0.03 |
+0.09 |
-0.27 |
-0.69 |
-0.05 |
through the filters |
|
500 m |
9.03 |
1.29 |
-2.98 |
-2.74 |
5.07 |
ffp, dB |
-0.03 |
-0.04 |
-0.06 |
-0.05 |
-0.06 |
engine - ffp |
|
+0.12 |
-0.19 |
-0.12 |
-0.82 |
-0.06 |
through the filters |
|
1 km |
6.79 |
1.37 |
1.43 |
1.55 |
6.63 |
ffp, dB |
+0.03 |
-0.05 |
-0.04 |
-0.11 |
-0.05 |
engine - ffp |
|
-0.22 |
-0.15 |
+0.12 |
-0.19 |
-0.05 |
through the filters |
|
2 km |
5.93 |
5.97 |
-0.51 |
4.14 |
4.18 |
ffp, dB |
-0.02 |
+0.07 |
-0.53 |
-0.75 |
-0.90 |
engine - ffp |
|
-0.33 |
+0.34 |
-1.32 |
-0.45 |
-0.90 |
through the filters |
case 3, upward refraction 0.1/s
distance |
63 |
125 |
250 |
500 |
1k |
|
|---|---|---|---|---|---|---|
100 m |
4.78 |
2.82 |
-2.44 |
-7.68 |
-0.30 |
ffp, dB |
-0.02 |
-0.01 |
-0.03 |
-0.07 |
-0.04 |
engine - ffp |
|
+0.03 |
+0.10 |
+0.01 |
-0.60 |
-0.04 |
through the filters |
|
200 m |
3.72 |
0.85 |
-7.14 |
-16.62 |
-11.46 |
ffp, dB |
-0.02 |
-0.02 |
-0.03 |
-0.08 |
-0.05 |
engine - ffp |
|
+0.05 |
+0.11 |
-0.12 |
-0.53 |
-0.05 |
through the filters |
|
500 m |
-0.84 |
-6.20 |
-20.67 |
-44.90 |
-52.70 |
ffp, dB |
-0.02 |
-0.00 |
-0.02 |
-0.10 |
-0.07 |
engine - ffp |
|
+0.07 |
+0.08 |
-0.88 |
-2.33 |
-0.07 |
through the filters |
|
1 km |
-10.83 |
-19.87 |
-43.44 |
-90.90 |
-100.23 |
ffp, dB |
-0.01 |
+0.01 |
+0.02 |
- |
- |
engine - ffp |
|
+0.06 |
-0.13 |
-3.40 |
- |
- |
through the filters |
|
2 km |
-33.35 |
-48.82 |
-78.33 |
-88.90 |
-94.67 |
ffp, dB |
-0.01 |
+0.01 |
- |
- |
- |
engine - ffp |
|
-0.13 |
-0.93 |
- |
- |
- |
through the filters |
0.1/s up to 100 m
distance |
63 |
125 |
250 |
500 |
1k |
|
|---|---|---|---|---|---|---|
100 m |
5.55 |
3.42 |
-2.27 |
-5.22 |
2.55 |
ffp, dB |
-0.05 |
-0.05 |
-0.04 |
-0.07 |
-0.04 |
engine - ffp |
|
+0.00 |
+0.06 |
-0.04 |
-0.68 |
-0.04 |
through the filters |
|
200 m |
6.21 |
2.97 |
-5.67 |
-6.00 |
2.28 |
ffp, dB |
-0.04 |
-0.04 |
-0.05 |
-0.07 |
-0.05 |
engine - ffp |
|
+0.03 |
+0.09 |
-0.27 |
-0.69 |
-0.05 |
through the filters |
|
500 m |
9.03 |
1.29 |
-2.98 |
-2.74 |
5.07 |
ffp, dB |
-0.03 |
-0.03 |
-0.06 |
-0.05 |
-0.06 |
engine - ffp |
|
+0.12 |
-0.18 |
-0.12 |
-0.81 |
-0.06 |
through the filters |
|
1 km |
6.74 |
1.38 |
1.43 |
1.55 |
6.63 |
ffp, dB |
+0.04 |
-0.04 |
-0.04 |
-0.11 |
-0.05 |
engine - ffp |
|
-0.21 |
-0.14 |
+0.13 |
-0.19 |
-0.05 |
through the filters |
|
2 km |
3.80 |
-1.16 |
-2.85 |
-5.93 |
1.15 |
ffp, dB |
-0.08 |
+0.01 |
-0.09 |
+0.44 |
+0.38 |
engine - ffp |
|
-0.43 |
-0.16 |
-0.01 |
-0.46 |
+0.38 |
through the filters |
-0.1/s up to 100 m
distance |
63 |
125 |
250 |
500 |
1k |
|
|---|---|---|---|---|---|---|
100 m |
4.78 |
2.82 |
-2.44 |
-7.68 |
-0.30 |
ffp, dB |
-0.01 |
-0.02 |
-0.03 |
-0.07 |
-0.04 |
engine - ffp |
|
+0.03 |
+0.08 |
+0.01 |
-0.60 |
-0.04 |
through the filters |
|
200 m |
3.72 |
0.85 |
-7.14 |
-16.62 |
-11.46 |
ffp, dB |
-0.02 |
-0.02 |
-0.03 |
-0.08 |
-0.05 |
engine - ffp |
|
+0.04 |
+0.11 |
-0.12 |
-0.53 |
-0.05 |
through the filters |
|
500 m |
-0.84 |
-6.20 |
-20.66 |
-44.81 |
-52.68 |
ffp, dB |
-0.01 |
-0.00 |
-0.04 |
-0.20 |
-0.08 |
engine - ffp |
|
+0.08 |
+0.08 |
-0.89 |
-2.39 |
-0.08 |
through the filters |
|
1 km |
-10.87 |
-19.88 |
-43.62 |
-66.43 |
-66.91 |
ffp, dB |
-0.03 |
-0.09 |
+1.48 |
- |
- |
engine - ffp |
|
+0.01 |
-0.23 |
-1.95 |
- |
- |
through the filters |
|
2 km |
-31.61 |
-43.55 |
-69.69 |
-91.23 |
-98.25 |
ffp, dB |
+0.06 |
+0.06 |
- |
- |
- |
engine - ffp |
|
+0.19 |
+0.18 |
- |
- |
- |
through the filters |
In still air the early paths are image sources read through the band filters, and the row through the filters is the one to compare: the engine is within 0.04 dB of the program up to 200 m and within 0.3 dB at 1 km, 0.5 dB at 2 km, where the ground dip at 250 Hz is 29 dB deep and the engine’s reflection factor is an approximation (see Ground reflection); from 1 kHz up, where the rays average the paths’ interference over the band exactly, within 0.005 dB. In wind the bands up to 2 kHz come from the parabolic equation, whose band levels are the averages over its frequencies (eight an octave, 24 from 1 kHz up), and the engine reports them as computed, so there the plain average is the row to read: from 63 to 500 Hz within 0.11 dB to 1 km in every case downwind, and upwind with the benchmark’s gradient (upwind with the gradient stopping at 100 m, see below); at 2 km downwind 0.5 to 0.8 dB with the gradient going on to 1000 m, where the pure tones above show the parabolic equation itself parting from the program, and 0.1 (0.4 at 500 Hz) with it stopping at 100 m. Upwind the engine follows the program into the shadow within 0.1 dB to 500 m and 45 dB below free field (0.20 dB with the gradient stopping at 100 m, at 500 Hz), and within 1.5 dB at 1 km with the gradient stopping at 100 m (250 Hz, 44 dB down, where the pure tones above show the parabolic equation straying deep in the shadow); the comparison stops 60 dB down. The 1 kHz band comes from the parabolic equation too: within 0.09 dB to 1 km, downwind and upwind, and at 2 km downwind 0.9 dB low with the gradient going on to 1000 m, as the bands below it there, and 0.38 dB high with it stopping at 100 m.
At the join between the parabolic equation’s bands and the rays’ each ray band keeps
its own spectrum, since a blend of spectra that stand for different sound (the whole
field over the ground on one path, each ray’s own on the others) would put a notch in
it, and a path that carries nothing in a band is left out of that band’s reading. The
equation’s bands carry its field at every frequency its runs took, and out of the shadow
the top one on through the crossover above it (engine/fine.py), so both bands of a
crossover give the same field there: in case 2 the dip in the crossover above the 2 kHz
band, 12.8 dB deep at 2.85 kHz 100 m away, comes out within 0.19 dB of the program from
2 to 3.45 kHz at 100 m, 0.05 and 0.28 dB at 150 and 200 m and 0.45 dB at 300 m (on the
rays’ side, 3.1 kHz), alike with 8 frequencies an octave and with the wide-angle
equation, the join of the equation’s 500 Hz and 1 kHz bands within 0.07 dB, and
third-octave runs within 0.12 and 0.58 dB at 100 and 300 m (tests/test_ffp.py). In
the shadow the bands keep their own samples (see Known issues).
Up to 500 Hz the echogram reads the bands through band filters from that field, the
63 Hz band’s run going on down to an octave below it, where its filter still reads it.
100 m downwind in case 2 and 200 m downwind in windy, C50 and C80 at 63 Hz are within
0.01 and 0.09 dB and within 0.06 and 0.07 dB of a run of the equation 27 times as dense
going on down to 11 Hz, read through the same filters (27 and 81 times, to 11 or
5.5 Hz, agree within 0.06 dB), where the band’s own samples were 0.30 and 0.29 dB and
0.91 and 0.19 dB off, and EDT within a step of the echogram (1 ms), where windy’s was
1.8 ms off (tests/test_ffp.py); a coverage map’s point keeps the same samples in these
bands as a listener there (tests/test_refraction.py). That run’s lowest frequency, 25 Hz,
thickens its absorbing layer, which moves the 63 Hz band’s level by 0.002 and 0.003 dB,
to within 0.0002 dB of a thicker one still. Above 63 Hz, where C50 and C80 are 50 to
88 dB, see Known issues.
The wide-angle parabolic equation
With simulation.early.parabolic_equation: wide_angle (--parabolic-equation wide_angle, Parabolic equation in the editor) the bands the parabolic equation
gives outdoors in wind or temperature gradients (see
Wind and temperature) come from
acoustic_spaces.engine.wide_angle instead of the narrow-angle default: the
split-step Padé parabolic equation of Collins (J. Acoust. Soc. Am. 93, 1993, 1736, as
in his program RAM). It marches the field with the one-way operator of the Helmholtz
equation, exact at every angle in air that does not change along the way, written as a
rational function of ten terms that never amplifies the waves that do not propagate
(RAM’s stability constraint), in steps of three wavelengths; the heights are finite
differences of fourth order, twenty points per wavelength, with the ground’s impedance
as the lower boundary, also to fourth order, and the field starts as the operator has
it (Collins’ self-starter, J. Acoust. Soc. Am. 92, 1992, 2069). The ten tridiagonal
solves of each step run in native code, the frequencies of a band on the run’s
threads.
tests/test_wide_angle.py checks each part on every change: one step against the
exact exponential of the operator, within 10⁻⁷ for sound up to 45 degrees from the
horizontal and 10⁻¹³ within 18 degrees of it; that it damps the waves that do not
propagate; the starting field’s rational function within 10⁻⁸ of its own; the native
solves against dense ones, and on any number of threads bit for bit; in still air the
complex pressure over grass within 0.5 % (0.04 dB, 0.3 degrees) of the exact solution
at 125 and 500 Hz; the field 45 degrees up within 0.15 dB of the exact one, where the
narrow-angle equation’s starting field falls 1 dB short; and the benchmark’s case 2 at
100 Hz within 0.05 dB of the fast field program to 5 km, where the narrow-angle
equation is 6 dB off.
The benchmark. At the 1995 benchmark’s pure tones (the table in Outdoor sound in wind) the wide-angle equation is within 0.05 dB of the fast field program in every case, from 10 Hz to 1 kHz and from 100 m to 10 km, wherever the sound is within 40 dB of free field, but for 0.11 dB at 1 kHz 10 km downwind; deeper in the shadow it is within 0.07 dB at 100 Hz and 1 kHz, and 0.3 to 0.4 dB at 10 Hz 5 km upwind, 41 to 44 dB down. With the benchmark’s gradients going on to a kilometre up, where the narrow-angle equation strays by 3 to 20 dB beyond 1 to 2 km downwind and by 8 dB 500 m into the shadow upwind at 1 kHz, the wide-angle one stays within 0.11 dB wherever the sound is within 40 dB of free field (0.28 dB at 10 Hz 5 km upwind, 41 dB down).
The weather presets. The gradients the engine is meant for change fastest near the ground. Both equations against the fast field program in the presets: a source 2 m and a listener 1.5 m up over the benchmark’s ground, at 20 °C, 50 to 300 m apart, the level re free field (dB) and each equation’s difference from it at the octave bands’ centre tones:
50 m |
100 m |
200 m |
300 m |
||
|---|---|---|---|---|---|
|
6.14 |
6.91 |
8.24 |
9.32 |
ffp, dB |
-0.19 |
-0.19 |
-0.16 |
-0.18 |
narrow - ffp |
|
+0.02 |
+0.04 |
+0.05 |
+0.06 |
wide - ffp |
|
|
4.76 |
5.33 |
5.66 |
4.67 |
ffp, dB |
+0.10 |
+0.10 |
-0.02 |
-0.11 |
narrow - ffp |
|
+0.00 |
+0.00 |
-0.02 |
-0.07 |
wide - ffp |
|
|
-2.27 |
-6.77 |
-26.18 |
-22.74 |
ffp, dB |
-0.16 |
-0.27 |
-0.04 |
-0.42 |
narrow - ffp |
|
-0.07 |
-0.15 |
-0.05 |
-0.18 |
wide - ffp |
|
|
-6.43 |
-6.84 |
-3.53 |
0.20 |
ffp, dB |
-0.07 |
-0.05 |
+0.06 |
+0.06 |
narrow - ffp |
|
+0.03 |
+0.03 |
+0.04 |
+0.04 |
wide - ffp |
|
|
3.78 |
5.02 |
3.98 |
3.25 |
ffp, dB |
+0.00 |
-0.02 |
+0.01 |
+0.01 |
narrow - ffp |
|
+0.01 |
+0.01 |
+0.03 |
+0.03 |
wide - ffp |
|
|
-0.02 |
4.78 |
-2.11 |
3.92 |
ffp, dB |
+0.13 |
-0.00 |
+0.17 |
-0.06 |
narrow - ffp |
|
-0.00 |
+0.00 |
+0.02 |
+0.01 |
wide - ffp |
|
|
4.86 |
3.93 |
1.91 |
-0.24 |
ffp, dB |
+0.19 |
+0.10 |
-0.07 |
-0.17 |
narrow - ffp |
|
-0.03 |
-0.05 |
-0.09 |
-0.12 |
wide - ffp |
|
|
3.41 |
1.58 |
-2.42 |
-6.73 |
ffp, dB |
-0.23 |
-0.31 |
-0.37 |
-0.48 |
narrow - ffp |
|
-0.01 |
-0.03 |
-0.07 |
-0.12 |
wide - ffp |
|
|
-0.29 |
-4.13 |
-12.53 |
-21.73 |
ffp, dB |
-0.05 |
-0.10 |
-0.20 |
-0.30 |
narrow - ffp |
|
+0.02 |
+0.01 |
-0.01 |
-0.05 |
wide - ffp |
|
|
-6.16 |
-14.45 |
-33.95 |
-56.97 |
ffp, dB |
-0.16 |
-0.16 |
-0.14 |
-0.12 |
narrow - ffp |
|
+0.05 |
+0.06 |
+0.05 |
+0.02 |
wide - ffp |
|
|
-2.40 |
-21.33 |
-75.77 |
-89.89 |
ffp, dB |
-0.15 |
-0.21 |
- |
- |
narrow - ffp |
|
+0.01 |
+0.02 |
- |
- |
wide - ffp |
|
|
1.76 |
-39.93 |
-105.59 |
-100.79 |
ffp, dB |
-0.15 |
-0.36 |
- |
- |
narrow - ffp |
|
+0.00 |
+0.04 |
- |
- |
wide - ffp |
|
|
5.32 |
5.02 |
4.36 |
3.66 |
ffp, dB |
+0.07 |
+0.05 |
+0.02 |
+0.00 |
narrow - ffp |
|
-0.01 |
-0.01 |
-0.02 |
-0.03 |
wide - ffp |
|
|
3.96 |
3.18 |
1.57 |
-0.03 |
ffp, dB |
-0.08 |
-0.09 |
-0.07 |
-0.08 |
narrow - ffp |
|
-0.00 |
-0.01 |
-0.01 |
-0.02 |
wide - ffp |
|
|
-0.47 |
-3.15 |
-8.20 |
-12.70 |
ffp, dB |
-0.02 |
-0.02 |
+0.01 |
+0.02 |
narrow - ffp |
|
+0.01 |
+0.02 |
+0.02 |
+0.03 |
wide - ffp |
|
|
-7.51 |
-13.17 |
-22.26 |
-30.27 |
ffp, dB |
-0.09 |
-0.10 |
-0.10 |
-0.09 |
narrow - ffp |
|
+0.01 |
+0.02 |
+0.02 |
+0.03 |
wide - ffp |
|
|
0.67 |
-7.25 |
-22.60 |
-38.38 |
ffp, dB |
-0.07 |
-0.08 |
-0.10 |
-0.11 |
narrow - ffp |
|
-0.00 |
+0.00 |
+0.00 |
-0.00 |
wide - ffp |
|
|
5.04 |
-3.35 |
-31.56 |
-68.48 |
ffp, dB |
-0.03 |
-0.08 |
-0.11 |
- |
narrow - ffp |
|
-0.00 |
+0.00 |
+0.00 |
- |
wide - ffp |
|
|
5.73 |
5.97 |
6.41 |
6.78 |
ffp, dB |
-0.05 |
-0.04 |
-0.01 |
-0.00 |
narrow - ffp |
|
+0.01 |
+0.01 |
+0.02 |
+0.02 |
wide - ffp |
|
|
4.39 |
4.37 |
4.18 |
3.78 |
ffp, dB |
+0.02 |
+0.03 |
+0.03 |
+0.03 |
narrow - ffp |
|
+0.00 |
+0.00 |
+0.01 |
+0.00 |
wide - ffp |
|
|
-1.06 |
-3.81 |
-10.28 |
-17.94 |
ffp, dB |
-0.07 |
-0.07 |
-0.13 |
-0.28 |
narrow - ffp |
|
-0.02 |
-0.03 |
-0.07 |
-0.13 |
wide - ffp |
|
|
-8.15 |
-11.48 |
-13.57 |
-13.55 |
ffp, dB |
-0.08 |
-0.07 |
-0.04 |
-0.04 |
narrow - ffp |
|
-0.00 |
-0.00 |
-0.00 |
+0.00 |
wide - ffp |
|
|
2.67 |
1.04 |
1.68 |
3.96 |
ffp, dB |
-0.01 |
-0.01 |
-0.02 |
-0.02 |
narrow - ffp |
|
+0.00 |
+0.00 |
+0.00 |
+0.00 |
wide - ffp |
|
|
-0.83 |
4.32 |
5.06 |
3.97 |
ffp, dB |
-0.11 |
-0.05 |
-0.04 |
-0.04 |
narrow - ffp |
|
+0.00 |
+0.00 |
+0.00 |
+0.00 |
wide - ffp |
The narrow-angle equation is within 0.10 dB of the program on average and 0.48 dB at
most (125 Hz, 300 m upwind in windy), the wide-angle one within 0.03 dB on average
and 0.18 dB at most, where the program is no deeper than 60 dB below free field (-).
Over each band as the engine reads it, the mean energy over its frequencies (eight an
octave, 24 at 1 and 2 kHz), the narrow-angle equation is within 0.07 dB on average and
0.38 dB at most, the
wide-angle one within 0.02 dB and 0.12 dB. In the weather near the
ground both hold, so the narrow-angle equation stays the default, being the faster
of the two.
Whole scenes. The benchmark’s cases 2 and 3 as whole scenes again (see
Outdoor sound in wind), with
parabolic_equation: wide_angle:
case 2, downward refraction 0.1/s
distance |
63 |
125 |
250 |
500 |
1k |
|
|---|---|---|---|---|---|---|
100 m |
5.55 |
3.42 |
-2.27 |
-5.22 |
2.55 |
ffp, dB |
+0.00 |
+0.00 |
-0.00 |
-0.00 |
-0.00 |
engine - ffp |
|
+0.05 |
+0.11 |
+0.00 |
-0.61 |
-0.00 |
through the filters |
|
200 m |
6.21 |
2.97 |
-5.67 |
-6.00 |
2.28 |
ffp, dB |
+0.00 |
+0.00 |
-0.00 |
+0.00 |
-0.00 |
engine - ffp |
|
+0.07 |
+0.13 |
-0.22 |
-0.62 |
-0.00 |
through the filters |
|
500 m |
9.03 |
1.29 |
-2.98 |
-2.74 |
5.07 |
ffp, dB |
+0.00 |
-0.00 |
-0.00 |
+0.00 |
-0.00 |
engine - ffp |
|
+0.15 |
-0.15 |
-0.06 |
-0.76 |
-0.00 |
through the filters |
|
1 km |
6.79 |
1.37 |
1.43 |
1.55 |
6.63 |
ffp, dB |
-0.00 |
+0.00 |
-0.00 |
-0.00 |
-0.00 |
engine - ffp |
|
-0.25 |
-0.10 |
+0.16 |
-0.08 |
-0.00 |
through the filters |
|
2 km |
5.93 |
5.97 |
-0.51 |
4.14 |
4.18 |
ffp, dB |
-0.00 |
-0.00 |
-0.00 |
-0.00 |
-0.00 |
engine - ffp |
|
-0.30 |
+0.27 |
-0.79 |
+0.29 |
-0.00 |
through the filters |
case 3, upward refraction 0.1/s
distance |
63 |
125 |
250 |
500 |
1k |
|
|---|---|---|---|---|---|---|
100 m |
4.78 |
2.82 |
-2.44 |
-7.68 |
-0.30 |
ffp, dB |
-0.00 |
-0.00 |
+0.00 |
+0.00 |
-0.00 |
engine - ffp |
|
+0.04 |
+0.10 |
+0.04 |
-0.54 |
-0.00 |
through the filters |
|
200 m |
3.72 |
0.85 |
-7.14 |
-16.62 |
-11.46 |
ffp, dB |
-0.00 |
-0.00 |
+0.00 |
+0.00 |
-0.00 |
engine - ffp |
|
+0.06 |
+0.12 |
-0.08 |
-0.45 |
-0.00 |
through the filters |
|
500 m |
-0.84 |
-6.20 |
-20.67 |
-44.90 |
-52.70 |
ffp, dB |
-0.01 |
-0.00 |
+0.00 |
+0.00 |
+0.01 |
engine - ffp |
|
+0.08 |
+0.08 |
-0.86 |
-2.23 |
+0.01 |
through the filters |
|
1 km |
-10.83 |
-19.87 |
-43.44 |
-90.90 |
-100.23 |
ffp, dB |
-0.01 |
-0.01 |
+0.01 |
- |
- |
engine - ffp |
|
+0.06 |
-0.14 |
-3.41 |
- |
- |
through the filters |
|
2 km |
-33.35 |
-48.82 |
-78.33 |
-88.90 |
-94.67 |
ffp, dB |
-0.04 |
-0.03 |
- |
- |
- |
engine - ffp |
|
-0.15 |
-0.96 |
- |
- |
- |
through the filters |
From 63 Hz to 1 kHz the engine’s levels are within 0.04 dB of the program’s band averages to 2 km, downwind and upwind (at 1 kHz upwind to 500 m, 53 dB down), where with the narrow-angle equation they are 0.5 to 0.9 dB off at 2 km downwind.
Each band of the wide-angle equation marches a grid of twenty points per wavelength of
its highest frequency in steps of three wavelengths, ten tridiagonal solves a step,
where the narrow-angle one takes a pair of Fourier transforms a step on a grid half as
fine, in steps of five wavelengths: five to eight times the time (5.4 to 5.7 on one
core for a listener 100 m out, 7.6 at 500 m and 6.3 to 6.5 at 2 km, over grass
in the windy preset and over asphalt in clear_night), all of it in the bands the parabolic equation gives. Neither equation is checked against measurements
in strong refraction, and neither is combined with a terrain yet (see
Outdoor scenes).
Steep sound. The narrow-angle equation’s phase shift at each step strays for sound
that comes in steeply, and its step is not converged: each step also adds an error at
the ground that shrinks with the height step, not the range step, so on its grid of
heights shorter steps add up more of it. From 1 m up to 1.5 m up, 200 m downwind in the
windy preset over grass, the 63 Hz band is 0.26 dB under the fast field program in
steps of five wavelengths, 0.14 dB over it in steps of one and 0.59 dB over it in steps
a 32nd as long. So the listeners that the reflection off the ground reaches more than 15
degrees up get the wide-angle equation’s level, with the narrow-angle equation too. They
get it in whatever air the parabolic equation runs, in the still air of a weather zone
as well, where the narrow-angle one is exact but at the ground: which equation a
listener takes then goes neither by its band nor by the run’s other listeners, as it
does when it is found from the air on the run’s grid (in a one-off check at 84 steep
points in still air, from sources 1.5 to 30 m up to listeners 1.5 to 30 m up, 8 to 100 m
away, over grass and over a ground of 20 000 kPa s/m², in the octave bands from 63 Hz to
2 kHz, it was 0.03 dB from the program on average and 0.16 dB at most, and moved by up
to 0.03 dB with its absorbing layer four times as high; the wide-angle one 0.01 and 0.15
dB, the same to 0.0001 dB under the higher layer; per third octave from 50 Hz to 2.5 kHz,
at three frequencies each, the narrow-angle one was 0.04 and 0.30 dB from the program
and the wide-angle one 0.02 and 0.34 dB, the largest of each at 63 Hz 8 m from the
source 2 m up, a wavelength and a half away). Against the program at the
frequencies the engine takes in each band, eight an octave band and three a third octave
(validation/steep_sound.py), in the windy preset downwind and upwind over grass,
from sources 5, 10, 30 and 120 m up to a listener 1.5 m up and from 1.5 m up to 30 m up,
at 16 ranges from 1.5 times their heights added (10 m at least) to 1 km and at two more
a hundredth of the range either side of 15 degrees (each case’s listeners in a line in
one scene), where the level is above -15 dB re free field, the mean (largest)
difference in dB:
bands |
15° or flatter, narrow-angle |
steeper, narrow-angle |
steeper, narrow-angle, half its step |
steeper, wide-angle |
|---|---|---|---|---|
octaves, 63 to 500 Hz |
0.10 (0.48) |
0.10 (0.41) |
0.09 (0.37) |
0.01 (0.05) |
third octaves, 50 to 250 Hz, sources 10 to 120 m up |
0.17 (0.87) |
0.24 (1.61) |
0.17 (0.73) |
0.03 (0.09) |
A quarter of the narrow-angle step leaves the steep points 0.10 (0.42) and 0.20 (0.69)
dB off. In 18 further cases (the windy preset and 10 m/s of wind down- and upwind,
clear_night, and sunny_day with 3 m/s of wind downwind; from 20 m up to 1.5 m up and
from 40 m up to 4 m up over grass, and from 60 m up to 4 m up over a ground of 2000 kPa
s/m²; the 63 and 125 Hz octaves and the third octaves from 80 to 160 Hz) the steep
points’ octave bands are 0.16 (0.96) dB off with the narrow-angle equation, 0.14 (0.93)
dB at half its step and 0.02 (0.09) dB with the wide-angle one, their third octaves 0.35
(2.20), 0.31 (1.96) and 0.04 (0.29) dB. In those cases the narrow-angle equation is about
as far off just under 15 degrees: from 10 to 15 degrees up it is 0.14 (1.05) dB off per
octave band and 0.38 (5.74) dB per third octave, the largest where the level is 14 dB
below free field (80 Hz, 287 m from the source 60 m up, downwind in 10 m/s of wind over
the hard ground; the wide-angle equation is 0.28 dB off there in a one-off check). So
the level jumps at 15 degrees by the narrow-angle equation’s error there: in the 28
cases of both sets, in the bands compared in each, per octave band by 0.12 dB on average
and up to 0.72 dB (125 Hz, from 60 m up to 4 m up, upwind in 10 m/s of wind over the
hard ground), per third octave by 0.27 dB and up to 2.3 dB (125 Hz in the same case),
where the level is above -15 dB re free field; at the five largest jumps in each kind of
band the wide-angle side is within 0.29 dB of the program and the narrow-angle side up
to 2.4 dB off.
By the angle at which the reflection off the ground reaches the listener, with each equation run at every point of each case’s line and at up to nine more between its ends, where the reflection comes in at 5.5 to 14 degrees, the mean (largest) difference in dB of the narrow-angle equation and, after it, of the wide-angle one:
reflection’s angle |
first set, octaves |
first set, third octaves |
further set, octaves |
further set, third octaves |
|---|---|---|---|---|
0 to 5° |
0.13 (0.48), 0.03 (0.14) |
0.22 (0.87), 0.07 (0.32) |
0.20 (1.10), 0.05 (0.20) |
0.24 (1.68), 0.07 (0.32) |
5 to 7° |
0.08 (0.42), 0.02 (0.06) |
0.13 (0.48), 0.03 (0.09) |
0.18 (1.21), 0.04 (0.14) |
0.32 (4.55), 0.07 (0.41) |
7 to 10° |
0.06 (0.25), 0.02 (0.05) |
0.12 (0.44), 0.03 (0.08) |
0.11 (0.63), 0.03 (0.13) |
0.25 (3.03), 0.07 (0.43) |
10 to 15° |
0.07 (0.23), 0.02 (0.04) |
0.15 (0.64), 0.03 (0.09) |
0.14 (1.21), 0.03 (0.14) |
0.35 (5.74), 0.07 (0.36) |
over 15° |
0.10 (0.41), 0.01 (0.05) |
0.24 (1.61), 0.03 (0.09) |
0.16 (0.96), 0.02 (0.09) |
0.35 (2.20), 0.04 (0.29) |
At every angle the narrow-angle equation is 0.06 to 0.35 dB off on average and the
wide-angle one 0.01 to 0.07 dB: its error does not begin at 15 degrees. A scene that
needs the wide-angle equation’s level at the flatter listeners too sets
parabolic_equation: wide_angle, at the run time given above.
Over the open ground other listeners in the same direction do not change a level.
Each listener is reached by a last step of its own off the march, and a run’s absorbing
layer starts where the layer of a run for each of its listeners alone would. A
listener’s own layer starts 1.5 times as high as the highest of the source, the listener
and the bent paths between them, at least 20 m above the two and 0.15 times the range
up; listeners share a run where those starts need the same grid of heights, a power of
two of them, and the layer starts as high as that grid holds it, for one listener as for
all. The listeners that take the wide-angle equation’s level, whose grid is as high as
its layer needs, share a run where their starts round up to the same of the heights
2^(k/2) m, where the layer then starts. In the lowest band a listener out of the shadow,
whose run goes on down to an octave below the band and has a thicker layer for it, runs
apart from those in the shadow. So a listener alone and the same one among others have
the same early energy in every band, within 10⁻¹² of it (tests/test_refraction.py:
with others farther away and higher up, downwind and upwind, on two threads, with the
wide-angle equation for all, under others in a weather zone, and from two sources whose
runs are shared). The level does go by where the listener’s own layer starts, more where
the narrow-angle equation is near its limit or the level is low. For a listener 45 m
from a source 10 m up over grass, which the reflection reaches 14 degrees up, 8.8 dB
below free field in its dip over the ground in the 200 Hz third octave, in still air
with a weather zone of the windy preset beginning 100 m away, the narrow-angle equation
is 0.05 to 0.14 dB under the program under seven layers that begin 30 to 450 m up, and
the wide-angle one 0.001 dB over it under each (a one-off check). So the level steps
where a listener’s own start needs the next grid of heights: in a one-off check of 37
such places 150 to 900 m from a source 2 m up, with listeners 1.5 m up half a percent
of the range either side, over grass in the windy preset, by 0.001 dB or less per
octave band and 0.011 dB or less per third octave where the level was less than 35 dB
below free field (23 places, down- and upwind), and by up to 0.57 dB per octave band and
3.2 dB per third octave upwind where it was more than 60 dB below it (14 places). Behind
barriers and buildings the others still change a level (see
Known issues). Where the
wide-angle equation runs behind a barrier its height step is shared too: it fits the
roof of a building further along the way once one of its points lies beyond the
building’s front (in a one-off check of the march, from a source 2 m up over a ground of
200 kPa s/m², a barrier 3 m high 15 m away and a building 60 to 75 m away with its roof
4 m up, down- and upwind in 5 m/s of wind, a point 90 m away moved the 63 Hz band 20 m
away by 0.018 dB, and the bands to 500 Hz 20 to 59 m away by 0.002 dB or less
otherwise). At 1 and 2 kHz, in a one-off check at the steep points of the first set’s
cases from sources 5, 10 and 30 m up to a listener 1.5 m up and from 1.5 m up to 30 m
up (42 points), the level is within 0.07 dB of the program at 1 kHz; at 2 kHz it is 0.11
to 0.49 dB off at each case’s nearest point, where the sound comes in at 34 degrees, and
within 0.27 dB at the others. The
steep listeners’ bands take the wide-angle equation’s time: about 6 times the
narrow-angle one’s on one core for three listeners 10 to 20 m up, 30 to 60 m from a
source 1 m up over a lawn in the windy preset.
Terrain against closed forms and the exact wedge
validation/terrain.py checks sound over a terrain (geometry.ground.terrain, see
Outdoor scenes) against closed forms and the exact solution for a
wedge, and times it on a large one. The early sound reflects off the mean plane of the
ground and bends over its crests as the uniform theory of diffraction has it, wedge after
wedge, with the ground’s reflections off the profile’s segments on both sides of each
crest among its terms; the late rays bounce off the terrain’s triangles. Levels are in dB
re the direct sound in free field over the same distance, the early paths added in
pressure in every band and the air’s attenuation taken off each path over its own length.
A flat terrain (every height alike, 101 × 101 points 10 m apart) against the flat ground: the direct sound and the one reflection have the same distances to the bit and energies within 2.2e-16, and whole runs (20,000 rays, the same seed) the same level relative to free field in every band, the two models differing only in how the ground is cut into triangles.
A plane sloping up 20 % against the image source in the tilted plane: the reflected path’s distance is the image’s to 2e-9 m and its energy within 1.1e-15 straight up the slope, and within 2 mm and 7e-5 with the listener 160 m aside, where the ground also tilts across the profile, which the mean plane, level across it as the standards have it, leaves out.
The mean plane of an uneven profile is CNOSSOS-EU’s, the least-squares line of the
whole profile: tests/test_terrain.py checks it against ISO/TR 17534-4’s test cases
TC05 and TC06 (the plane’s slope and height and the equivalent heights of the source and
the receivers over it, to the tables’ two decimals), and that the same ground on a 10 m
and on a 5 m grid gives the same reflection.
A ridge, two slopes of 0.6 meeting at 241.9 degrees, with the source on one slope and the listener in its shadow on the other, against the Biot-Tolstoy-Medwin solution for the rigid wedge (Edge diffraction), integrated along 640 m of the edge, per octave band; the engine’s path is the wedge of the string pulled taut over the profile, with the reflections off both slopes in its four terms:
source, listener (m over the slopes) |
63 |
125 |
250 |
500 |
1k |
2k |
4k |
8k |
|
|---|---|---|---|---|---|---|---|---|---|
2.0 at 30 m before, 1.5 at 30 m behind |
-11.27 |
-14.21 |
-17.21 |
-20.21 |
-23.22 |
-26.23 |
-29.24 |
-32.25 |
exact, dB |
+0.00 |
+0.00 |
+0.00 |
+0.00 |
-0.00 |
+0.00 |
+0.00 |
+0.00 |
engine - exact |
|
1.0 at 40 m before, 4.0 at 60 m behind |
-13.32 |
-16.28 |
-19.28 |
-22.29 |
-25.30 |
-28.31 |
-31.32 |
-34.33 |
exact, dB |
+0.00 |
+0.00 |
+0.00 |
-0.00 |
-0.00 |
+0.00 |
-0.00 |
+0.00 |
engine - exact |
|
3.0 at 20 m before, 1.5 at 40 m behind, 30 m aside |
-9.81 |
-12.72 |
-15.71 |
-18.72 |
-21.73 |
-24.74 |
-27.75 |
-30.76 |
exact, dB |
+0.09 |
+0.09 |
+0.09 |
+0.09 |
+0.09 |
+0.09 |
+0.09 |
+0.09 |
engine - exact |
The engine agrees within 0.005 dB for the first two pairs and is 0.09 dB high in every band for the third. A ridge sampled on a grid is the exact wedge, which sits at the crest with no width and has the slopes for its faces; the uniform theory’s four terms, a high-frequency form of the exact solution, come that close to it here. The third pair is oblique, 30 m aside of the plane through the source and the crest.
A smooth hill, 12 m high with a Gaussian profile 25 m wide at half its height, the source and the listener 1.5 m up 40 m before and behind its crest, 2.71 m of path difference over it. A rounded crest has no exact solution, so the sound over it is compared with the engineering formulas the standards use for the same path difference: over a soft ground (absorption 0.999), Maekawa’s thin screen without ground reflections (10 lg(3 + 20 N), ISO 9613-2 with C₂ = 40), and over a rigid ground, ISO 9613-2’s figure with C₂ = 20 (10 lg(3 + 10 N)), which stands for the reflections off a typical ground:
63 |
125 |
250 |
500 |
1k |
2k |
4k |
8k |
||
|---|---|---|---|---|---|---|---|---|---|
soft ground |
-11.94 |
-14.49 |
-17.37 |
-20.57 |
-23.59 |
-26.55 |
-29.57 |
-32.57 |
engine, dB |
-13.60 |
-16.28 |
-19.14 |
-22.07 |
-25.04 |
-28.03 |
-31.03 |
-34.03 |
thin screen, 10 lg(3 + 20 N) |
|
+1.66 |
+1.79 |
+1.76 |
+1.49 |
+1.45 |
+1.48 |
+1.46 |
+1.46 |
engine - thin screen |
|
rigid ground |
-6.81 |
-14.34 |
-16.72 |
-14.98 |
-19.67 |
-23.28 |
-25.45 |
-28.60 |
engine, dB |
-11.12 |
-13.57 |
-16.28 |
-19.14 |
-22.07 |
-25.04 |
-28.03 |
-31.03 |
ISO 9613-2, 10 lg(3 + 10 N) |
|
+4.32 |
-0.77 |
-0.43 |
+4.16 |
+2.40 |
+1.76 |
+2.57 |
+2.43 |
engine - ISO |
Over the soft ground the engine lets 1.4 to 1.8 dB more over the hill than the thin screen, evenly across the bands. The engine bends the sound over the wedge of the hill’s chords at the crest, open wider than a half-plane, where Maekawa’s chart is for a thin screen; this check does not separate how much of the difference that makes. Over the rigid ground the reflections off both flanks join the direct wave, each by way of the ground near its foot, 0.86 m longer than the straight line to the crest (the source’s image in the flat ground before the hill is that much farther from the crest than the source): in phase at 63 Hz (5.1 dB more than over the soft ground, 4.3 above the standard’s typical ground), against it near 200 Hz, where that extra path is half a wavelength (the ground dip: 0.15 and 0.65 dB more than over the soft ground at 125 and 250 Hz, a little below the standard’s figure), and from 500 Hz up 3.3 to 5.6 dB more than over the soft ground (1.8 to 4.2 above the standard), where the waves no longer interfere alike across a band and add in energy: 6 dB for four of a size, less because the reflected ones come from images deeper in the shadow. The standard’s figure stands for a ground that reflects less than a rigid one. Both are engineering comparisons, not exact solutions.
Climbing out of the shadow behind the same hill over the rigid ground, from 1.5 to 29.5 m up in steps of 0.5 m, the level changes by at most 0.6 dB a step at 63 Hz and 3.0 dB at 8 kHz, where the edge of the shadow is sharpest (the line of sight clears the hill from 23.2 m up), and never falls by more than 1.8 dB a step, in the ground’s interference and the lit zone’s ripples:
up (m) |
63 |
125 |
250 |
500 |
1k |
2k |
4k |
8k |
|---|---|---|---|---|---|---|---|---|
1.5 |
-6.81 |
-14.34 |
-16.72 |
-14.98 |
-19.67 |
-23.28 |
-25.45 |
-28.60 |
4.0 |
-9.64 |
-14.02 |
-16.65 |
-16.40 |
-19.95 |
-23.27 |
-25.98 |
-29.13 |
6.5 |
-9.86 |
-11.74 |
-15.29 |
-15.95 |
-19.10 |
-22.40 |
-25.13 |
-28.20 |
9.0 |
-8.00 |
-11.19 |
-14.31 |
-15.17 |
-18.31 |
-21.72 |
-24.51 |
-27.59 |
11.5 |
-6.44 |
-10.57 |
-13.44 |
-14.17 |
-17.38 |
-20.80 |
-23.59 |
-26.66 |
14.0 |
-5.21 |
-9.91 |
-12.21 |
-12.93 |
-16.04 |
-19.42 |
-22.22 |
-25.29 |
16.5 |
-4.36 |
-8.72 |
-10.61 |
-11.22 |
-14.06 |
-17.34 |
-20.11 |
-23.17 |
19.0 |
-3.66 |
-7.49 |
-8.57 |
-8.92 |
-11.12 |
-13.96 |
-16.55 |
-19.52 |
21.5 |
-2.85 |
-6.24 |
-6.14 |
-6.06 |
-6.95 |
-8.40 |
-9.65 |
-11.44 |
24.0 |
-2.06 |
-5.01 |
-3.52 |
-2.95 |
-2.20 |
-1.46 |
+0.32 |
+1.17 |
26.5 |
-1.24 |
-3.85 |
-1.18 |
-0.33 |
+0.86 |
+0.96 |
+0.93 |
+0.55 |
29.0 |
-0.51 |
-3.09 |
+0.64 |
+0.91 |
+0.26 |
+0.98 |
+0.45 |
+0.91 |
At 63 Hz the level first falls as the listener rises, from -6.8 dB at 1.5 m to -9.9 at 6.5 m: the reflection off the ground behind the hill, in phase with the wave over the crest at the ground, lags it more the higher the listener. From there every band rises through the edge of the shadow, 12.6 dB in the 2.5 m round the line of sight at 8 kHz, and every band but 125 Hz comes to within 1 dB of free field above it, where the direct sound, the ground’s reflection and the crest’s wave ripple together; 125 Hz stays 3 to 4 dB down (-3.9 and -3.1 dB at 26.5 and 29 m).
Cost. Rolling hills 2 km across on a 20 m grid (10,000 cells, 21,233 triangles with a building): the model builds in 0.3 s, its 8 diffracting edges (the building’s) are found in 0.1 s, the early path over the hills in 0.4 s and a whole run with 20,000 rays takes 0.8 s, on four cores of a cloud machine with nothing else running. The terrain costs the late rays nothing beyond the triangles it adds, and the early sound the profile and the string over it, once per listener.
Outdoor scenes on the GPU
The GPU tracer (simulation.late.device: gpu, both or auto) follows the rays bent by
wind and temperature, takes them through
vegetation and lets them out through the open sky, as the CPU’s
does; the wave solver on the GPU steps its grid with the speed of sound per cell. The
tests check each against the CPU, and validation/outdoor_gpu.py compares whole runs of
the outdoor examples.
Chords, ray for ray. The GPU works in single precision, and its sines, cosines and arc tangents are only guaranteed to about 11 bits, which moved a few percent of the chords’ ends by metres in a first port: the chords are therefore stepped without trigonometry (the ray’s direction kept as a cosine and sine pair, the turn over a step summed as a series). 4,000 rays from random places in random directions, half of them leaving a plane they must not meet again, in four atmospheres (sound speed rising or falling 0.3/s to 100 m up, a wind of 6 m/s, and a wind of 4 m/s with the speed falling 0.1/s): the GPU’s chords turn back where the CPU’s do (every one), point the same way at their ends to 3e-5, and stretch as far to a part in 5,000 for 99 % of them (the rest end where the chord’s tolerance is met a little sooner or later as the turn gathered along it rounds, by up to 1.2 % where the wind shears hard just above the ground). Cut to a common length, the two chords are the same curve: ends within 0.32 mm and times within 4e-6 s, over 400 m.
Energy and time. In a field 400 m across under a 200 m sky, 200,000 rays per run, listeners 100 m off downwind, upwind, across the wind and 60 m up: the energy per listener and band and the mean time it arrives at, the rays bent up out of the field and the energy over time the weight window reads, agree with the CPU’s within the noise of the ray count, in a warmer sky (sound bent down), a cooler one (bent up) and a wind with a cooler sky. The energy over time is compared as what is left of it from each 10 ms window on: in single precision a ray bent over many chords and bounces arrives a little sooner or later now and then, and its energy lands in the next window (on every GPU, and more on Direct3D 12’s software GPU in Windows CI). With only mirror reflections in the warmer sky, one window held 7 % less than the CPU’s and the next 4 % more (15 % and 8 % on Direct3D 12), while what is left from each window on agreed to 0.1 % (0.2 % on Direct3D 12) wherever it was at least a hundredth of the whole: a shift the weight window, rounded to quarter octaves, cannot tell. Through a crown of foliage and a stand of stems, the energy each band loses, the energy scattered on and where it goes, with and without an atmosphere, agree the same way; a tree belt of 17 media is declined with its reason and traced on the CPU.
Whole runs. validation/outdoor_gpu.py simulates the outdoor examples with their own
settings, but for grounds that scatter 0.1 where the examples’ scatter nothing (over
those no late ray reaches the stage’s listeners or the hillside’s crest), once per
device and once more on the CPU with the next seed, and compares the
late sound’s level per band and its centre time at every listener (the mean absolute
difference over listeners and bands); the next seed shows how much the ray count’s noise
alone moves them:
Scene |
Faces |
Rays |
Device |
Late (s) |
Level diff (dB) |
Centre time diff (ms) |
|---|---|---|---|---|---|---|
open_air_stage |
12 |
50,000 |
cpu, next seed |
0.59 |
4.21 |
6.0 |
open_air_stage |
12 |
50,000 |
gpu |
20.21 |
0.02 |
0.2 |
tree_belt |
30 |
200,000 |
cpu, next seed |
1.12 |
1.20 |
22.3 |
tree_belt |
30 |
200,000 |
gpu |
33.30 |
1.29 |
13.0 |
hillside |
3,730 |
50,000 |
cpu, next seed |
0.34 |
2.04 |
1.9 |
hillside |
3,730 |
50,000 |
gpu |
11.49 |
1.88 |
1.6 |
On SwiftShader, a software Vulkan driver on the container’s 4 cores (the CPU runs took
0.3 to 1.1 s), which shows that the two agree, not how fast a GPU is; python validation/outdoor_gpu.py times your own. The GPU rows are from that run, when the
port was added; the CPU’s next-seed rows come out the same with this version’s code
(the container that checked them has no GPU driver). The tree belt’s rows are from when it traced its image sources to the first order; at the second, as it does now, the house’s reflection keeps its ground partners, the late sound changes with it, and the next seed differs by 1.32 dB and 20.6 ms (seeds 1 and 2; its GPU row needs a run on a GPU). The tree belt’s rays through its foliage and
stems come out as far from the CPU’s as the next seed’s do. The stage in the wind
agrees to 0.02 dB with the same seed, whose rays start where the CPU’s do; the next
seed starts them elsewhere and moves the late sound at the two listeners downwind by
4.2 dB on average (upwind, in the wind’s shadow, no late ray arrives in either run).
The stage’s eddies play no part in this: they act on the early paths only, and the
script compares the late sound (without them the next seed differs by the same
4.21 dB). On the hillside the GPU was 1.9 dB from the CPU in that run, against the
next seed’s 2.0 dB now: the listener in the shadow gets no late rays, the one on the crest about the
same level from every run, and the one on the slope a level that moves by several
decibels with the seed, so one run of each, as here, cannot tell the GPU’s difference
from the rays’ noise there.
The wave solver in wind. The GPU steps the tests’ grids with a speed of sound that grows with height, bending the sound as the rays do, to within 3e-5 of the largest pressure of the CPU’s (single-precision rounding; 2e-3 on Intel Macs, whose GPU drifts further), its matched layer within 1e-5, and the 63 and 125 Hz bands of a scene whose sound speed rises from 337 m/s at the ground to 402 m/s at the top of the grid within 1e-5, the two naming the same slowest and fastest speed of sound.
Weather zones against a Crank-Nicholson parabolic equation
validation/weather_zones.py checks the engine where the weather changes on the way
(see Weather zones). The reference is a Crank-Nicholson
parabolic equation written for the script (Salomons, Computational atmospheric
acoustics, appendix G): a narrow-angle equation marched in steps of a quarter
wavelength on a grid of a tenth of a wavelength, with the ground’s impedance as its
lower boundary, a Gaussian starter and an absorbing layer at the top, which takes the
speed of sound of whichever zone each step lies in. The script first checks the
reference itself: against the exact solution for the reflection off grass in still air
it is within 0.17 dB at 63 to 500 Hz out to 800 m, and against the engine’s own
parabolic equation in the windy preset over the whole way it is within 0.35 dB to
400 m, 0.5 dB at 63 Hz 800 m out and 1.4 dB at 500 Hz 800 m out, where the two
equations’ starters and absorbing layers part.
The source is 2 m high and the listener 1.5 m, over grass (flow resistivity 200 kPa s/m²), and the weather changes 150 m from the source:
case |
from the source |
past 150 m |
|---|---|---|
shelter downwind |
|
0.5 m/s |
gust downwind |
0.5 m/s |
5 m/s |
shelter upwind |
5 m/s towards the source |
0.5 m/s |
inversion past a lake shore |
|
|
cool water downwind |
|
from 100 to 300 m the ground at 12 °C instead of 20 |
The parabolic equation through the zones. The engine’s parabolic equation marches through the zones, changing its speed of sound where its path crosses a border. The level re free field (dB) in pure tones, and in brackets the difference from the reference of the engine’s narrow-angle parabolic equation, its default, and then of its wide-angle one (see The wide-angle parabolic equation):
case, tone |
100 m |
200 m |
400 m |
800 m |
|---|---|---|---|---|
shelter downwind, 63 Hz |
6.67 (-0.22, -0.07) |
7.14 (-0.10, -0.08) |
6.65 (-0.08, -0.06) |
5.49 (-0.08, -0.04) |
shelter downwind, 125 Hz |
3.16 (+0.09, +0.03) |
0.97 (+0.14, +0.03) |
-4.63 (+0.04, +0.06) |
-15.71 (-0.22, +0.07) |
shelter downwind, 250 Hz |
-21.10 (-0.34, -0.02) |
-22.24 (-0.17, +0.00) |
-25.09 (-0.24, +0.02) |
-28.48 (-0.38, -0.03) |
shelter downwind, 500 Hz |
-4.54 (+0.01, -0.01) |
-4.37 (+0.13, +0.03) |
-7.94 (+0.10, +0.08) |
-9.24 (+0.08, +0.10) |
gust downwind, 63 Hz |
5.50 (-0.02, -0.04) |
6.09 (-0.14, -0.04) |
7.35 (-0.14, -0.08) |
4.00 (-0.35, -0.11) |
gust downwind, 125 Hz |
2.41 (+0.02, +0.02) |
1.11 (-0.04, +0.02) |
-7.70 (+0.17, -0.09) |
-12.62 (+0.03, +0.03) |
gust downwind, 250 Hz |
-10.56 (-0.04, +0.03) |
-25.63 (-0.53, -0.09) |
-23.87 (+0.39, +0.07) |
-17.53 (+0.18, +0.02) |
gust downwind, 500 Hz |
-10.77 (-0.07, -0.01) |
-11.59 (-0.12, +0.05) |
-2.05 (-0.02, +0.05) |
1.88 (-0.36, -0.36) |
shelter upwind, 63 Hz |
3.77 (+0.16, +0.05) |
2.59 (+0.01, +0.08) |
1.97 (+0.02, +0.05) |
0.45 (+0.02, +0.02) |
shelter upwind, 125 Hz |
0.53 (-0.16, +0.07) |
-2.60 (-0.26, +0.12) |
-5.98 (-0.23, +0.09) |
-12.88 (-0.20, +0.06) |
shelter upwind, 250 Hz |
-8.22 (-0.01, +0.07) |
-17.69 (+0.08, +0.14) |
-29.33 (+0.07, +0.12) |
-39.75 (-0.12, -0.07) |
shelter upwind, 500 Hz |
-17.84 (+0.04, +0.20) |
-35.34 (+0.02, +0.45) |
-47.37 (-0.09, +0.48) |
-61.17 (-0.14, +0.42) |
inversion past a lake shore, 63 Hz |
5.36 (+0.00, -0.04) |
5.43 (-0.03, -0.04) |
5.71 (-0.01, -0.06) |
5.08 (-0.02, -0.07) |
inversion past a lake shore, 125 Hz |
2.29 (+0.01, +0.02) |
0.69 (-0.00, +0.02) |
-3.31 (+0.05, +0.01) |
-16.52 (-0.12, -0.01) |
inversion past a lake shore, 250 Hz |
-10.04 (-0.02, +0.03) |
-20.50 (-0.19, -0.00) |
-27.08 (-0.01, +0.00) |
-26.87 (-0.02, +0.05) |
inversion past a lake shore, 500 Hz |
-11.44 (-0.07, -0.00) |
-15.67 (-0.11, +0.01) |
-14.45 (-0.11, +0.01) |
-8.31 (-0.07, +0.03) |
cool water downwind, 63 Hz |
6.67 (-0.22, -0.07) |
7.70 (-0.23, -0.05) |
8.43 (-0.21, -0.05) |
4.36 (-0.42, -0.03) |
cool water downwind, 125 Hz |
3.16 (+0.09, +0.03) |
1.03 (+0.18, +0.10) |
-14.52 (+0.73, +0.32) |
-15.33 (+0.22, +0.18) |
cool water downwind, 250 Hz |
-21.10 (-0.34, -0.02) |
-24.13 (-0.18, +0.06) |
-21.07 (+0.17, +0.07) |
-15.33 (-0.01, -0.04) |
cool water downwind, 500 Hz |
-4.54 (+0.01, -0.01) |
-0.95 (-0.07, +0.04) |
3.66 (+0.01, -0.03) |
0.89 (-1.19, -1.20) |
The engine is within 0.15 dB of the reference on average and 1.19 dB at most, at 500 Hz 800 m out over the cool water, where the two equations part by 1.4 dB in the uniform wind too. The wide-angle equation is within 0.09 dB on average and 1.20 dB at most, at the same point, where the engine’s two equations agree within 0.01 dB and the reference, a narrow-angle equation with a Gaussian starter, is the one that parts; elsewhere it is within 0.5 dB, the most 47 dB down in the upwind shadow at 500 Hz. The shelter downwind bends the sound down over the first 150 m and then lets it spread, 13 dB less than the uniform wind at 250 Hz 800 m out and 10 dB less at 500 Hz, where the wind would bring the sound back to the ground; the gust turns still air’s ground dip into the wind’s pattern past the border; the inversion past the shore carries 20 dB more than still air at 500 Hz 800 m out; and the cool water deepens the 125 Hz dip 400 m out by about 1.5 dB.
The mean profile along the way. The early paths bend through one profile, the mean along their way, each zone’s weighted by the length of the way over it. The parabolic equation through that mean profile against the parabolic equation through the zones, at 500 Hz, 1 kHz and 2 kHz (averaged over the band’s frequencies; the profile the rays’ bands, 4 and 8 kHz, take), from 200 m on (nearer, the way lies under one weather); the level re free field through the zones, and in brackets the mean profile’s difference from it:
case, band |
200 m |
400 m |
800 m |
|---|---|---|---|
shelter downwind, 500 Hz |
-1.35 (+0.51) |
-5.21 (+3.33) |
-6.13 (+4.22) |
shelter downwind, 1 kHz |
3.11 (+1.38) |
3.87 (-0.72) |
4.06 (+1.75) |
shelter downwind, 2 kHz |
3.45 (+1.84) |
1.96 (+3.60) |
0.33 (+6.57) |
gust downwind, 500 Hz |
-9.12 (+0.72) |
-0.49 (+3.32) |
-0.93 (+1.97) |
gust downwind, 1 kHz |
3.22 (+1.28) |
2.24 (+1.25) |
-0.88 (-2.71) |
gust downwind, 2 kHz |
1.75 (+3.78) |
-0.30 (+3.55) |
-0.33 (-1.23) |
shelter upwind, 500 Hz |
-34.56 (+1.97) |
-46.14 |
-58.52 |
shelter upwind, 1 kHz |
-62.73 |
-77.33 |
-89.45 |
shelter upwind, 2 kHz |
-58.80 |
-79.26 |
-96.83 |
inversion past a lake shore, 500 Hz |
-13.92 (+0.29) |
-11.21 (-0.02) |
-4.08 (+1.21) |
inversion past a lake shore, 1 kHz |
1.91 (+2.02) |
5.98 (+2.05) |
3.63 (+3.32) |
inversion past a lake shore, 2 kHz |
3.67 (-0.13) |
5.80 (+1.65) |
4.04 (+2.48) |
cool water downwind, 500 Hz |
1.99 (+0.08) |
0.97 (+0.29) |
1.21 (-0.02) |
cool water downwind, 1 kHz |
3.47 (-0.06) |
-0.66 (-0.01) |
-2.39 (-0.10) |
cool water downwind, 2 kHz |
3.11 (+0.18) |
1.89 (-0.34) |
-1.10 (-0.11) |
Over the 37 points above -40 dB re free field the mean profile is within 1.6 dB on average and 6.6 dB at most; the 8 points deeper in the upwind shadow are left out, as sound there is inaudible next to any other and the parabolic equation itself is at the floor of its absorbing layer. Over the cool water, which changes the air near the ground for 200 m, the mean profile is within 0.35 dB. Where the wind changes, or an inversion sets in past the shore, it gives more sound at most points, mostly 1 to 4 dB and 6.6 dB at most (2 kHz, 800 m downwind of the shelter), but up to 2.7 dB less at 800 m past the gust and 0.7 dB less at 1 kHz 400 m past the shelter: one profile cannot both bend the sound down over the first 150 m and let it go straight after, and bends it a little the whole way instead. That is the cost of the equivalent profile the standards take (Nord2000, Harmonoise), and a reason the bands up to 2 kHz come from the parabolic equation, which goes through the zones.
Barriers and buildings in wind against a full-wave solution
validation/barrier_wind.py checks the weather’s effect behind barriers and buildings
(see How the simulation bends sound): the
level in the weather less the level in still air, which the engine takes from its
parabolic equation with the barriers and buildings inside (a barrier lets nothing
through below its top, a roof is a rigid floor) and puts on the paths it finds in still
air. Two references are written for the script, and the wind is a logarithmic profile
over a roughness of 5 cm, 5 or 10 m/s 10 m up, towards the listener or the source:
A full-wave solution: the Helmholtz equation round a source on an axis, in air whose speed of sound changes with height, solved by coupled modes stepping in range (Evans 1983): exact in range, a twentieth of the shortest wavelength in height, a perfectly matched layer on top of a domain 30 m high (60 m where given). Barriers are thin rigid rings round the source and a building a rigid ring block; the wind blows through them; 63 to 500 Hz, over rigid ground and over grass (Miki’s impedance, 200 kPa s/m²). Where given it is also solved along a plane, from a line source with straight barriers (the two dimensions of the engine’s equation, where nothing focuses the sound going back between two barriers as a ring does). It checks itself: over open rigid ground it is within 0.002 dB of the exact field of the source and its image, round the axis and along the plane; a barrier in still air is -0.10 to +0.03 dB from a straight barrier’s four paths (the uniform theory of diffraction) at 125 and 250 Hz as a ring and +0.04 to +0.09 dB along the plane; over open ground in 5 m/s of wind it is within 0.25 dB of the engine’s parabolic equation at each frequency of the 125 Hz band; and deep in the upwind shadow of a barrier 4 m high 15 m from a source 1 m up, at 552 Hz, the domain 30 m high is within 0.00 dB of one 90 m high 120 m away in 5 m/s of wind (1.2 dB in 10 m/s) but 1.0 and 10.5 dB off 150 and 200 m away (15 and 45 dB in 10 m/s), and 60 m high within 0.04 dB in 5 m/s and 1.24 dB in 10 m/s, which is why the cases upwind beyond 120 m take it.
A parabolic equation started behind the barrier from the exact field of a rigid straight barrier over rigid ground (the four paths), 1 m behind it (within 0.18 dB of those paths in still air), and marched in a wind that blows behind the barrier only (the engine’s equation is given the same), 125 Hz to 8 kHz (from 4 kHz up to 100 m only): the
windypreset downwind and upwind,clear_nightandsunny_day, barriers 3 and 6 m high 20 and 50 m from a source 1 m up, listeners 50, 100 and 200 m away, 1.5 and 4 m up.
The full-wave cases (source 1 m up unless given; listeners 1.5 m up unless given):
case |
on the way |
listeners (m away) |
|---|---|---|
near |
barrier 15 m away, 4 m high; also along a plane |
30, 60, 120; 60 at 4 m up |
far |
barrier 100 m away, 4 m high |
110, 130; 130 at 4 m up |
rail |
source 0.5 m up, barrier 4 m away, 3 m high |
25, 50, 100 |
steep 45 and 60 |
source 0.5 m up, barrier 4 m away, 4.5 and 7.43 m high (its top 45 and 60 degrees up from the source) |
15, 30, 60 |
roof |
building 40 to 52 m away, 6 m high |
80, 150 |
two |
barriers 45 and 55 m away, 8 m high; also along a plane |
100, 150 |
two 40 |
barriers 20 and 60 m away, 3 and 5 m high; 125 and 250 Hz; also along a plane |
100, 160 |
near upwind |
as near, upwind only, 5 and 10 m/s, on a domain 60 m high |
60, 120, 200; 120 at 4 m up |
rooftop |
source 7 m up on a building from the axis to 5 m, 6 m high |
27.5, 42.5, 100 |
mast |
source 10 m up, building 15 to 25 m away, 6 m high |
40, 45, 50, all 10 m up |
Against the full-wave solution. The engine’s weather effect less the solution’s, the largest difference (dB) over the listeners and the bands 63 to 500 Hz, at the engine’s own frequencies (the solution’s tops on its cells), and the solution’s effects:
case |
reference |
ground |
5 m/s downwind |
5 m/s upwind |
8 m/s downwind |
10 m/s downwind |
10 m/s upwind |
the effect |
|---|---|---|---|---|---|---|---|---|
near |
ring |
rigid |
0.32 |
0.62 |
0.63 |
-6.8 to +10.3 |
||
near |
ring |
grass |
0.29 |
0.57 |
0.46 |
-7.3 to +8.3 |
||
near |
plane |
rigid |
0.27 |
0.61 |
0.53 |
-6.9 to +10.4 |
||
near |
plane |
grass |
0.24 |
0.53 |
0.45 |
-7.4 to +8.4 |
||
far |
ring |
rigid |
0.38 |
0.42 |
0.67 |
-11.6 to +2.8 |
||
far |
ring |
grass |
0.47 |
0.41 |
0.74 |
-7.8 to +10.4 |
||
rail |
ring |
rigid |
0.25 |
0.38 |
0.27 |
-6.4 to +3.6 |
||
rail |
ring |
grass |
0.21 |
0.35 |
0.25 |
-6.1 to +9.5 |
||
steep 45 |
ring |
rigid |
0.43 |
0.45 |
0.98 |
-6.8 to +4.1 |
||
steep 45 |
ring |
grass |
0.17 |
0.41 |
0.50 |
-1.1 to +3.5 |
||
steep 60 |
ring |
rigid |
0.54 |
0.53 |
0.41 |
-7.4 to +6.5 |
||
steep 60 |
ring |
grass |
0.10 |
0.40 |
0.46 |
-1.3 to +3.1 |
||
roof |
ring |
rigid |
0.15 |
0.24 |
0.32 |
-6.1 to +9.7 |
||
roof |
ring |
grass |
0.40 |
0.21 |
0.51 |
-6.8 to +8.1 |
||
rooftop |
ring |
rigid |
0.09 |
0.18 |
0.31 |
-8.4 to +3.7 |
||
rooftop |
ring |
grass |
0.13 |
0.17 |
0.22 |
-3.4 to +2.4 |
||
mast |
ring |
rigid |
0.03 |
0.03 |
0.05 |
-0.5 to +0.3 |
||
mast |
ring |
grass |
0.02 |
0.02 |
0.04 |
-0.6 to +0.3 |
||
two |
ring |
rigid |
1.00 |
1.68 |
1.49 |
-6.7 to +17.3 |
||
two |
ring |
grass |
0.87 |
0.75 |
1.63 |
-4.4 to +5.2 |
||
two |
plane |
rigid |
1.00 |
1.63 |
1.61 |
-6.6 to +17.4 |
||
two |
plane |
grass |
0.82 |
0.69 |
1.73 |
-2.2 to +5.3 |
||
two 40 |
ring |
rigid |
2.23 |
0.69 |
4.95 |
0.73 |
-5.9 to +2.0 |
|
two 40 |
ring |
grass |
1.01 |
0.40 |
1.28 |
1.15 |
-1.3 to +0.6 |
|
two 40 |
plane |
rigid |
2.19 |
0.75 |
4.91 |
0.77 |
-5.9 to +2.1 |
|
two 40 |
plane |
grass |
0.96 |
0.36 |
1.21 |
1.06 |
-1.3 to +0.7 |
|
near upwind |
ring |
rigid |
0.71 |
1.64 |
-14.5 to +9.3 |
|||
near upwind |
ring |
grass |
0.61 |
1.37 |
-18.8 to +2.9 |
Behind one barrier or building the engine is within 0.71 dB in 5 m/s of wind (at 500 Hz
120 m behind the near barrier 4 m up, upwind over rigid ground) and 0.74 dB downwind in
10 m/s. Upwind in 10 m/s it comes out low, by 0.2 to 1.64 dB, the more the higher the
band and the farther the listener (1.64 dB at 500 Hz 120 m away 4 m up, 1.0 to 1.4 dB at
250 Hz 120 and 200 m away): the narrow-angle equation’s error, as the sound comes down
steeply into the shadow. Behind a top 45 degrees up from the source it is within
0.98 dB in 10 m/s at 250 Hz over rigid ground, 60 degrees up 0.54 dB. From a source
1 m over the roof of a building 6 m high it is within 0.31 dB (250 Hz 100 m away in
10 m/s downwind over rigid ground), and with the source and the listeners 10 m up,
higher than the building (mast), within 0.05 dB. Behind two
barriers 10 m apart it is off by up to 1.73 dB, and 40 m apart by up to 4.95 dB at
250 Hz in 8 m/s downwind over rigid ground (2.23 dB in 5 m/s, 1.28 dB over grass): the
equation marches away from the source only, so nothing goes back and forth between the
barriers in it. Along a plane the solution’s effect is within 0.14 dB of the
ring’s, so the ring’s focusing between the barriers does not explain it. The limits of
the script (LIMITS) are these largest errors rounded up to 0.05 dB, so that a change
that makes any of them worse fails. Deeper than 25 dB below still air (listed, not
judged) the engine is off by up to 4.2 dB 39 dB below (500 Hz 200 m away upwind in
10 m/s over grass) and 20 dB 52 dB below.
Against the started parabolic equation. The engine’s weather effect less the reference’s, the largest difference (dB) over the listeners where the reference is within 25 dB of still air, at the engine’s own frequencies (16 an octave at 4 kHz, 32 at 8 kHz), and the reference’s still air against the four paths it starts from:
case |
125 Hz to 2 kHz |
4 and 8 kHz |
starting field |
|---|---|---|---|
|
0.27 |
0.27 |
0.06 |
|
0.42 |
0.17 |
0.18 |
|
0.27 |
0.30 |
0.02 |
|
0.42 |
0.25 |
0.06 |
|
0.47 |
0.26 |
0.02 |
|
0.15 |
0.18 |
0.06 |
|
0.24 |
0.11 |
0.06 |
The engine is within 0.47 dB everywhere (0.5 allowed). Deeper in the upwind shadow, where the effect is listed but not bounded, it is within 0.81 dB down to 57 dB below still air, but 6.5 and 17.4 dB off at 2 kHz 72 and 74 dB below.
The engine end to end. simulate’s early paths (their coherent sum; reflections
off both sides of an edge) in the wind less in still air, against the full-wave
solution’s effect, over rigid ground with the barriers and the building 1 km long: the
largest difference (dB) over the listeners and the bands 63 to 500 Hz where the
solution is within 25 dB of still air:
case |
reference |
5 m/s downwind |
5 m/s upwind |
8 m/s downwind |
10 m/s downwind |
10 m/s upwind |
|---|---|---|---|---|---|---|
near |
ring |
0.33 |
0.66 |
0.64 |
||
far |
ring |
0.41 |
0.43 |
0.66 |
||
rail |
ring |
0.26 |
0.38 |
0.29 |
||
steep 45 |
ring |
0.44 |
0.45 |
1.01 |
||
steep 60 |
ring |
0.53 |
0.51 |
0.43 |
||
roof |
ring |
0.15 |
0.24 |
0.32 |
||
two |
ring |
1.00 |
1.69 |
1.53 |
||
two 40 |
ring |
2.23 |
0.69 |
4.95 |
0.73 |
|
two 40 |
plane |
2.19 |
0.76 |
4.91 |
0.77 |
|
near upwind |
ring |
0.71 |
1.70 |
End to end the engine’s difference from the solution is within 0.08 dB of its parabolic equation’s alone, 0.18 dB behind the top 60 degrees up (0.15 dB allowed); behind the top 45 degrees up it is 1.01 dB off in 10 m/s and behind two barriers 1.69 dB, as its equation is.
Convergence. The engine’s runs behind barriers take a quarter wavelength’s height
step from 1 kHz up (a tenth below) and 8 frequencies a band up to 2 kHz, 16 at 4 kHz and
32 at 8 kHz. The weather’s effect from its parabolic equation alone against finer runs
(--only convergence), the largest difference (dB) over the listeners and both winds
of 5 m/s: a tenth’s step against the quarter’s, and 32 frequencies an octave against 8
and 16, 64 against 32. high is a barrier 3 m high 10 m from a source 1 m up, with
listeners 25 m away 10 and 14 m up and 40 m away 1.5 m up:
case |
ground |
step, 1 and 2 kHz |
step, 4 and 8 kHz |
frequencies, 63 Hz to 2 kHz |
4 kHz |
8 kHz |
|---|---|---|---|---|---|---|
near |
rigid |
0.09 |
0.01 |
0.22 |
0.04 |
0.04 |
near |
grass |
0.07 |
0.05 |
0.08 |
0.07 |
0.03 |
rail |
rigid |
0.16 |
0.08 |
0.13 |
0.06 |
0.13 |
rail |
grass |
0.18 |
0.09 |
0.08 |
0.10 |
0.18 |
roof |
rigid |
0.06 |
0.05 |
0.22 |
0.04 |
0.03 |
roof |
grass |
0.08 |
0.09 |
0.12 |
0.03 |
0.02 |
steep 60 |
rigid |
0.28 |
0.97 |
0.53 |
0.18 |
0.51 |
steep 60 |
grass |
0.23 |
2.19 |
0.40 |
0.21 |
0.13 |
high |
rigid |
0.07 |
0.01 |
0.11 |
0.02 |
0.05 |
high |
grass |
0.04 |
0.01 |
0.09 |
0.02 |
0.02 |
The quarter wavelength’s step costs 2 to 2.5 times less than the tenth’s and holds
within 0.2 dB but 11 m behind the top 60 degrees up, where it is 0.3 dB off at 1 and
2 kHz and 1.0 and 2.2 dB at 4 kHz over rigid ground and grass. The ground’s
interference fringes behind a barrier are dense in frequency: at 8 kHz 16 frequencies an
octave are off by up to 1.8 dB against 32 over rigid ground and 6.4 dB at high’s
listener 14 m up, where the fringes fall in step with them (a one-off check), which is
why the 8 kHz band takes 32, within 0.18 dB of 64 but 0.51 dB 11 m behind the steepest
top.
Steep points behind a building. Where the sound reaches a point more steeply than 15
degrees the engine’s runs take the wide-angle equation, which holds a building’s roof as
a rigid floor on its height steps, as the narrow-angle one does between them (--only steep). 60 m from a source 1 m up, behind a building 20 to 30 m away with its roof 8 m
up, in 10 m/s downwind over rigid ground, the weather’s effect steps by 0.30, 0.05,
0.02, 0.01 and 0.35 dB at 125 Hz to 2 kHz between listeners 15 and 15.5 m up, either
side of that angle: the narrow-angle equation’s own error below it. From 10 to 24 m up
it is within 0.31 dB of the full-wave solution’s at 125 Hz and 0.09 dB at 250 Hz; the
wide-angle equation alone within 0.02 and 0.08 dB, the narrow-angle one within 0.45 and
0.09 dB. A source or a listener on a roof starts or ends the march over it: from a
source 1 m over a long rigid roof in still air both equations are within 0.11 dB of the
source and its image in the roof 10 to 60 m away (tests/test_parabolic_obstacles.py).
Continuity. How much the level steps as one thing changes a little, end to end
(simulate, the coherent sum of the early paths), the most in any band, in the
windy preset down- and upwind and in still air (a one-off check). The scene: a
source 1 m up over hard ground and a barrier 4 m high 15 m away across the way:
what changes |
in the wind (dB) |
in still air (dB) |
aim (dB) |
|---|---|---|---|
the wind, from none to 0.01 m/s (0.1 m/s) |
0.024 (0.24) |
0.2 at 0.1 m/s |
|
the barrier’s top, 1 mm higher (listeners 40 and 60 m away) |
0.020 |
0.006 |
0.01 |
a listener 40 m away, 1 cm higher through the line of sight over the top |
0.077 |
0.070 |
0.05 |
a building’s roof 25 to 37 m away, 1 cm higher, from 6 to 6.3 m (listeners 60 and 120 m away, 5 m off its middle) |
0.14 |
0.021 |
0.1 a cell |
a listener 60 and 120 m away behind a barrier slanted at 63 degrees to the way, 0.01 degrees round, from 0.40 to 0.60 degrees |
0.017 |
0.018 |
|
a listener 2 cm further, where the parabolic equation starts (a 1.5 m barrier 2 m from a source 0.5 m up) |
0.24 |
0.16 |
|
a listener 1 mm either side of the shadow boundary of a barrier’s end, 60 and 120 m away |
0.04 and 0.22 |
0.04 and 0.17 |
1 |
a listener 10 cm across a roof edge’s shadow boundaries, of the direct sound and of the ground reflection, 28 and 43 m from a source 1 m over the roof (and the source and the listener swapped) |
0.11 and 0.09 |
0.09 and 0.04 |
|
a listener 2 cm further, where the parabolic equation starts, 12.75 m from a source 1 m over a roof 6 m high (and the two swapped) |
0.13 |
0.024 |
|
a listener 1.5 m over a roof 45 m away, 1 mm either side of the shadow boundary of a barrier’s end (and the two swapped) |
2.83 |
2.79 |
|
a listener 1 mm either side of the line of an end below the line of sight seen from above (a barrier 1 m high 30 m away), 100 and 200 m away |
12.8 and 6.0 |
0.01 |
The wind’s effect grows in proportion to the wind (500 Hz, 100 m away and 4 m up),
with no step as it starts. The roof stands at its own height between the parabolic
equation’s cells (the field over it mirrored about that height), so as it rises the
weather’s effect behind it changes smoothly with it: by up to 0.13 dB a centimetre at
1 kHz downwind and 0.14 dB at 4 to 8 kHz upwind, 0.03 dB a millimetre, and from 63 to
500 Hz by 0.03 dB at most, about as in still air; on the grid it stepped from one cell
to the next by up to 0.50 dB at 1 kHz in the same places. Between two whole
degrees the listener takes both runs’ effects, so the level turns smoothly round. The
steps at a barrier’s end come from the plane’s two dimensions (see
What is not modelled yet): the paths over the
top take the barrier’s effect, past the end too as they fade out there, and the direct
sound the open ground’s, and the paths round the end change as the open ground’s
field along their way does. Across the end’s shadow boundary the level steps by at
most 0.04 dB a millimetre 60 m away, 0.07 dB 120 m downwind and 0.22 dB 120 m upwind,
where still air steps by 0.17 dB (more with eddies and at 4 and 8 kHz in weather
zones); across the line of an end below the line of sight, where the direct sound goes
from the barrier’s effect to the open ground’s, by up to 0.94 dB a millimetre from 63
to 250 Hz, 4.7 dB from 500 Hz to 2 kHz 100 m away and 6.0 dB 200 m away, and 12.8 dB
at 8 kHz upwind (see Known issues). From a source or to a
listener on a roof the equation holds the building, and across the roof edge’s shadow
boundaries the weather’s effect jumps by at most 0.04 dB in any band, octave or third
octave, against the steps either side (tests/test_barriers_in_wind.py); where the
equation starts, the effect steps by up to 0.12 dB (see Known issues).
Rows of roofs and barriers against a wave calculation
validation/rows.py checks the solver for sound that passes close over a whole row of
edges (acoustic_spaces.engine.rows): the roofs along a street, a roof and the parapet
behind it, screen after screen. Near grazing incidence each edge of such a row stands in
the others’ transition zones, and paths over one edge or two do not add up to the field
(see Known issues). The solver marches the engine’s parabolic equation
over the row in still air, in the vertical plane through the source and the listener,
from both ends, with a barrier or a wall as a screen that lets nothing through below its
top and a roof as a rigid floor, and adds for each rigid edge what the uniform theory of
diffraction gives it beyond such a screen, lit by the marched field at the edge. That
theory takes a barrier for a half-plane, lit by the end and by its image in the surface
it stands on. A barrier alone between the ends on a rigid ground, or on a rigid roof
under both, is with its image in that surface a rigid strip in free space, whose field
has an exact solution: there the solver adds what the strip sheds beyond the march’s
screen instead (acoustic_spaces.engine.strip, up to a height of 32 over the
wavenumber, five wavelengths), which holds the sound that goes on between the barrier’s
top and the surface too. Each march begins at its first obstacle, from the field that
its end and the end’s image in the ground have there (for an end over a roof: at the
first top past it, with the end’s image in the roof), and its field becomes a point
source’s by the length of the path pulled taut over the tops, so that the way from the
street up to a roof may be steep. Outdoor simulations take a row’s sound from it (see
Sound over rows of barriers and
buildings): the check is of the
solver by itself and, for the cases on a ground, of whole simulations (further down).
The reference is a wave calculation written apart from the engine: finite differences in
time in two dimensions (cells of 2 cm, rigid obstacles as whole cells, matched layers on
every side, 0.5 s), turned into a point source’s field by the integral over the
wavenumber along the edges. With one rigid screen it is within 0.14 dB of the exact
solution, the direct sound and the Biot-Tolstoy-Medwin integral over the edge, which the
script checks on every run. Its levels for the 149 cases, and for 66 of them with the
ends offset along the edges (see the ways at a slant below), are stored beside the
script (rows_wave.json); --references computes them again, 3 to 6 minutes for a
listener’s place on one core.
The rows stand between x = 0 and 10 m, the source 10 m before x = 0 and the listener 5 m
past x = 10 m: one screen; one roof 4, 9 or 10 m wide; a roof 9 m wide and a screen 1 m
past it, with its top level with the roof or up to 0.5 m below or above it; two roofs 4
m wide and 2 m apart; two roofs side by side, the second 0.2 or 1 m lower or higher; two
and three screens; three roofs 2 m wide. In free space the source is a centimetre to 2 m
above the roofs’ plane and the listener a centimetre above it or 0.5 or 2 m below (the
screen whose top passes that plane rises up to half a metre above both). On a
rigid ground 6 m below the tops, the source is a centimetre or half a metre above the
tops and the listener a centimetre above them or half a metre below, or either stands
1.5 m above the ground. The table gives the level in the octave bands from 63 to 500 Hz,
which a scene adds in pressure, less the wave calculation’s (dB), by the angle the sound
bends by at the row’s first or last edge. The simulation’s columns are the early stage
of the same scenes with the paths over the edges alone (the roofs and screens given as
a model file’s faces), either way round, with every sequence of reflections tested
(method: image_sources); first_order has no path over two edges and so no
sound where neither end sees over the row. In the last five lines the source stands
over a roof instead, 0.5 or 3 m before x = 10 m, a centimetre or 1.5 m above it: the
roof ends there, with no parapet or one 0.1, 0.3 or 1.1 m high on its edge, and the
listener stands 5 m past the edge, 2 m below the roof or 1 m above it; or the roof
goes on under the listener, who is 1.5 m above it, with a screen of those heights at
x = 10 m:
rows |
cases |
march alone |
the solver |
simulation, |
simulation, |
|---|---|---|---|---|---|
free space, up to 6° |
52 |
-1.96 to -0.03 |
-0.38 to +0.18 |
-20.60 to +6.64 |
-21.72 to +14.16, or no sound |
free space, 22° down to the listener |
8 |
-2.26 to -0.88 |
-0.16 to +0.14 |
-20.57 to +1.09 |
-1.22 to +8.42 |
roofs and one screen on a ground, up to 6° |
16 |
-1.66 to -0.28 |
-0.50 to +0.65 |
-10.63 to +1.74 |
-11.79 to +7.99 |
the same, 13 to 24° up from the source |
8 |
-2.70 to -1.43 |
-0.74 to +0.41 |
-6.22 to +7.86 |
-0.93 to +9.05, or no sound |
the same, 42° down to the listener |
12 |
-5.29 to -2.19 |
-0.71 to +1.24 |
-4.69 to +7.35 |
-1.94 to +8.21, or no sound |
three screens on a ground, up to 6° |
4 |
-3.53 to -1.10 |
-1.26 to +0.07 |
-11.27 to +2.21 |
-3.35 to +5.66 |
three screens on a ground, 24° |
2 |
-6.19 to -2.90 |
-2.55 to -0.30 |
-1.97 to +4.59 |
+3.53 to +6.51, or no sound |
three screens on a ground, 42° |
3 |
-9.20 to -4.06 |
-3.42 to -0.09 |
-2.65 to +4.57 |
+2.01 to +7.61, or no sound |
a roof under the source, to its edge |
8 |
-2.16 to +0.81 |
-0.18 to +0.05 |
-0.10 to +0.23 |
-0.10 to +0.23 |
the same, a parapet 1.1 m high on the edge |
8 |
-9.90 to +0.33 |
-0.82 to +0.48 |
-1.10 to +1.13 |
-1.12 to +1.17 |
the same, the parapet 0.1 or 0.3 m high |
16 |
-5.75 to +1.02 |
-1.13 to +1.13 |
-1.06 to +1.95 |
-0.98 to +1.56 |
a screen 1.1 m high on a roof under both ends |
4 |
-8.75 to +0.88 |
-0.05 to +0.42 |
-3.43 to +2.68 |
-3.43 to +2.68 |
the same, the screen 0.1 or 0.3 m high |
8 |
-4.85 to +0.93 |
-0.13 to +0.50 |
-2.91 to +1.38 |
-2.91 to +1.38 |
The march alone is low: a screen that reflects nothing lets through less than a rigid edge. With what the edges add the solver is within 0.38 dB of the wave calculation near grazing incidence in free space (0.24 dB but for two roofs side by side with a step of 1 m between them, in the 63 Hz band), the roofs of different heights and the screen whose top passes the roof’s plane included (within 0.18 dB as that top rises from 0.5 m below the plane to 0.5 m above), and within 0.65 dB over roofs and one screen on a rigid ground. Where the sound bends widely at the row’s ends: within 0.16 dB down to a listener 2 m below the last top and 5 m past it in free space (22°); on the ground within 0.74 dB up from a source 4.5 m below the first top (13 to 24°); and down to a listener at street level right behind the row (42°) within 0.15 dB behind one roof, 0.47 dB behind one screen, 0.71 dB behind two roofs and 1.24 dB behind a roof with a screen 1 m past it. With the source over a roof the solver is within 0.18 dB up to the roof’s edge, where the march alone is up to 2.16 dB low; with a parapet 1.1 m high on the edge within 0.82 dB (in the 63 Hz band, where the parapet is a fifth of a wavelength high; 0.48 dB in the others), and with one 0.1 or 0.3 m high within 1.13 dB. A screen on a roof that goes on under the listener, which the solver takes as a strip, is within 0.42 dB at 1.1 m and 0.50 dB at 0.1 and 0.3 m, where the simulation’s paths over its top are up to 3.43 dB off: see the barriers lower than a wavelength below.
In an outdoor scene the early stage takes the solver’s sound for the row, in still air
and in wind (simulation.early.rows: solver, the default). With --engine the 45 cases
on a ground are simulated as outdoor scenes too, their roofs as buildings and their
screens as barriers 400 m long (second_order, reflections on both sides of an edge,
every sequence of reflections tested, a response of 0.5 s, which ends before what comes
back from the far ends of those buildings and barriers): with the solver the
simulation’s level is the solver’s own within 0.02 dB in every band (the air takes its
energy along the path pulled taut over the tops in the one and along the straight line
in the other). Against the wave calculation (dB), and with rows: edges, the paths over
the edges alone:
row |
cases |
|
|
|---|---|---|---|
one screen |
9 |
-0.15 to +0.47 |
-0.87 to +0.54 |
one roof 10 m wide |
9 |
-0.16 to +0.14 |
-3.81 to +3.37 |
a roof 9 m wide and a screen 1 m past it |
9 |
-0.60 to +1.23 |
-6.22 to +5.41 |
two roofs 4 m wide, 2 m apart |
9 |
-0.74 to +0.64 |
-10.63 to +7.85 |
three screens |
9 |
-3.42 to +0.07 |
-11.30 to +4.52 |
The simulation gives the solver the early paths’ eight frequencies in each octave band, as the solver’s own check does. Against 72 in a band, at nine places behind one screen 3 or 4 m high the band levels with eight are within 0.10 dB at seven, and 0.24 and 0.38 dB off in the 500 Hz band at the other two (10 m behind the screen 4 m high). Near the end of a top the solver’s sound gives way to the paths over the edges (see the link above): with a listener 10 m behind a barrier 30 m long, 10 m from the source, moved along it and past its end in steps of 2 m, the level stays within 0.26 dB of the paths’ in every band, and is the paths’ own from where the way crosses the barrier 5 m before its end. In wind behind a barrier 300 m long the weather changes the level by as much with the solver as with the paths over the edges (within 0.001 dB, 25 and 85 m behind it).
One rigid screen has an exact solution, the direct sound and the Biot-Tolstoy-Medwin integral over the edge, which holds the solver closer to a wall than the wave calculation’s cases come. In free space, over a grid of 1670 places of the two ends (the source 5 cm to 30 m before the screen and from 20 m below its top to 5 m above, the listener 0.3 to 40 m past it and from 22 m below to 5 m above), the solver is within 0.36 dB of it in the 63 Hz band, 0.33 dB in the 125 Hz band and 0.24 dB in the 250 and 500 Hz bands, wherever it takes the two (1362 to 1485 of the places, by the band); ends within decimetres of the top and the top’s place within the march’s cells are looked at closer below. In the tests’ seven places with the source or the listener 39 to 86° below the screen’s top (a source half a metre before a screen 8 m above it), the march alone is 3 to 11 dB low.
On a rigid ground the same integral gives the four paths over the top, from the source
and its image in the ground to the listener and its image, but not the sound that goes
on between the top and the ground: the exact level there is that of the rigid strip
which the screen makes with its image in the ground (validation/barrier_strip.py), and
the solver takes that strip up to a height of 32 over the wavenumber. A screen 3 to 20 m
high, with the source 0.5 to 30 m before it and the listener 0.5 to 40 m past it, each
0.5 to 4 m above the ground (672 places): where the solver takes the strip it is within
0.18 dB of the exact level in the 63 Hz band (605 places), 0.22 dB in the 125 Hz band
(495), 0.24 dB in the 250 Hz band (235) and 0.31 dB in the 500 Hz band (95), where the
four paths are up to 0.71, 0.30, 0.31 and 0.23 dB from it; in the other bands of the 563
places that it takes in every band, above that height or with both ends close to a high
screen, it is within 0.31 dB of the four paths. In the tests’ seven places on a rigid
ground the march alone is 1.7 to 28 dB low. Where the first or the last stretch of the
path pulled taut over the tops is steeper than 30°, the marches run on a grid of
heights eight times as high: deep in the shadow of a high wall the level depends on the
height of that grid (behind a wall 20 m high, with both ends 5 m from its foot, 46 dB
below the free field, by up to 4.6 dB on the usual grid and 0.72 dB on one four times
as high).
A roof’s corner has an exact solution too, with the reflection off the roof. Over a grid of 591 places (the source on the roof or up to 3 m above it, 5 cm to 10 m before the roof’s far corner; the listener 0.5 to 40 m past the corner, from 8 m below the roof to 2 m above it), the solver is within 0.30 dB of it in the 63 Hz band, 0.25 dB in the 125 Hz band, 0.35 dB in the 250 Hz band and 0.53 dB in the 500 Hz band, wherever it takes the two (494 to 538 of the places, by the band); in the tests’ thirteen places the march alone is between 5.8 dB below it and 0.7 dB above. With a barrier 0.5 to 2 m high on a roof that both ends stand over, the source 5 cm to 10 m before the barrier and up to 3 m above the roof, the listener 0.5 to 15 m past it and up to 4 m above the roof, the solver is within 0.50 dB of the exact level of the strip that the barrier makes with its image in the roof in the 63 Hz band, 0.29 dB in the 125 Hz band, 0.38 dB in the 250 Hz band and 0.37 dB in the 500 Hz band, in the 456 to 513 of 630 places it takes, where the four paths over a screen on a rigid ground are up to 2.92, 3.05, 1.88 and 0.95 dB from it and the march alone between 23.7 dB below it and 2.3 dB above. The 0.50 dB is the march’s: with a barrier 1.1 m high, the source 3 m before it and 3 m above the roof and the listener half a metre past it and 1.5 m up, the sound comes down to the top at 32° and goes on up at 39°, and the march is 0.50 dB below the open field with Kirchhoff’s screen, for which the strip’s part takes it.
Ways that cross the row at a slant. Seen from above, a way seldom crosses a row’s
edges at right angles. The solver takes the angle by which each obstacle is turned from
across the way (slants), and takes the row in one of two ways. In the first the
marches run in the vertical plane along the way as before, and each edge’s terms are
those of the edge at its slant, on the shortest way from end to end over it. One edge
between the ends has its exact solutions at a slant too. One rigid screen is within 0.10
dB of the direct sound and the edge integral at 30, 60 and 75°, at four places of the
source and the listener; taken as an edge across the way, as the vertical section along
the way shows it, the solver is 0.09 to 0.62, 0.54 to 2.84 and 1.48 to 5.33 dB low
there. A roof’s corner is within 0.11, 0.36 and 0.61 dB at those slants, the most with
an end a metre before the corner (within 0.29 dB otherwise). A barrier 0.1 to 3 m high
on a rigid ground, which the solver takes as the strip summed for ends apart along it,
is within 0.08 dB of the strip’s exact level at 30 to 75° in eight places, where it is
0.21 to 7.61 dB off when not turned.
In a row a march lights the edges, and the march’s way over an edge, in the vertical plane along the way, is longer than the sound’s own where an end’s way to the row is steep: at 60°, from a source level with two roofs and 10 m before them to a listener 4.5 m below them and 5 m past them (both across the edges), by 8 cm, and by 38 cm for the way to the listener’s image in the ground. The edges’ terms have the phase of the sound’s own way and the marched field that of the section, and the two do not add up: given that row all the same, the first way would be up to 6.4 dB above the wave calculation. It does not take a row where the section’s phase on those terms would change a band’s sound by more than a tenth of it, nor an edge in a row that is turned more than 60° (one edge that both ends light themselves: 75°).
Such a row is taken the second way where it stands on a rigid ground with all its edges
in one direction, turned up to 75°: solved across its edges and moved to the slant. A
rigid row that is the same all along its edges answers a point source’s pulse, between
ends y apart along the edges, as it does straight across them at the time sqrt(t² -
y²/c²), so that every way between the ends and their images has its own path at the
slant. At a frequency that is a sum of the row’s sound across its edges over a lattice
of wavenumbers, whose weights hold the row’s response up to 8 m past the longest of
those ways. The sum moves a free field and its reflection off the ground to slants of 3
to 80° within 0.002 of the direct sound. For a row it is as good as the solver is across
the row at the lattice’s wavenumbers, for the part of the row’s response that the
weights hold, as long as the response has ended a period of the lattice less the
weights’ fade past the shortest way (what arrived later would come into the sum out of
place); the solver takes a row down to ends half a wavelength apart over the tops. Where
the sound crosses the row at a lower wavenumber, or weights of more than a tenth of the
first arrival’s lie below it, the row is out of reach this way too (OutOfReach): one
screen with the ends 6.8 m apart across it in the 63 and 125 Hz bands at 75°. One rigid
screen moved so is within 0.15 dB of the exact solution at 2 to 75° (the first way
within 0.06 dB at those places), and a barrier 0.1 to 8 m high on a rigid ground within
0.15 dB of the strip’s exact level, or of the four paths over its top, in eight of ten
cases at 30 to 75°, and 0.23 and 0.29 dB above it in the two others (the first way
within 0.08 dB in all ten). The solver takes the first way where it can: on the 66 cases
below at 30 and 60° the second takes 7.5 times as long (by set and slant 1.6 to 54
times), and where both take a band their levels are within 0.23 dB of each other (0.37
dB over three screens on a rigid ground).
The wave calculation’s scenes are the same all along their edges, so each run also gives the sound between ends offset along them; with one screen that is within 0.14 dB of the exact solution at 30, 60 and 75° as well. Its levels for 66 of the cases are stored at those three slants, and the solver takes every band of every one. The table gives its level less the wave calculation’s (dB), and its level with the row as the vertical section shows it, not turned:
rows |
band levels |
30°: the solver |
not turned |
60°: the solver |
not turned |
75°: the solver |
not turned |
|---|---|---|---|---|---|---|---|
free space, up to 6° |
80 |
-0.19 to +0.17 |
-0.35 to +0.07 |
-0.54 to +0.63 |
-1.81 to -0.12 |
-0.41 to +0.66 |
-2.60 to -0.50 |
free space, 22° down to the listener |
32 |
-0.18 to +0.15 |
-0.30 to -0.06 |
-0.22 to +0.17 |
-1.37 to -0.52 |
-0.19 to +0.37 |
-2.50 to -0.80 |
a roof under the source, to its edge |
32 |
-0.15 to +0.03 |
-0.26 to +0.13 |
-0.08 to +0.19 |
-0.82 to +0.85 |
-0.14 to +0.32 |
-1.38 to +0.88 |
a screen 1.1 m high on a roof under both ends |
16 |
-0.02 to +0.31 |
-0.63 to +0.41 |
-0.02 to +0.30 |
-3.41 to +0.89 |
-0.02 to +0.30 |
-5.73 to +1.33 |
the same, the screen 0.1 or 0.3 m high |
32 |
-0.11 to +0.53 |
-0.29 to +0.91 |
-0.15 to +0.53 |
-2.53 to +2.16 |
-0.19 to +0.21 |
-4.14 to +3.39 |
two roofs on a ground |
36 |
-0.75 to +0.85 |
-1.46 to +0.36 |
-1.26 to +0.59 |
-4.79 to +1.90 |
-1.16 to +1.21 |
-5.90 to +1.32 |
three screens on a ground |
36 |
-3.21 to +0.65 |
-4.15 to +0.07 |
-5.78 to +0.49 |
-8.76 to +0.06 |
-8.18 to +2.39 |
-9.73 to -1.87 |
The first way takes the rows in free space at 30 and 60°, and the roof under the source and the screens on a roof at every slant. The second takes the rows on a ground but for the 63 Hz band at 30° at 15 of 18 places (57 of 72 band levels at 30°, all at 60 and 75°), and at 75° the rows in free space (104 of 112 band levels).
In free space and over a roof the solver is as close at 30 and 60° as across the row, but in the 63 Hz band at 60°: over three screens it is 0.44 to 0.54 dB low there and over three roofs 0.60 to 0.63 dB high, and within 0.22 dB in every other case and band. At that slant the row is, in wavelengths across its edges, what it is across the way an octave lower, and across the way in the 31.5 Hz band the solver is 0.30 to 0.33 dB below a wave calculation of the three screens (5 m apart, a third to two thirds of a wavelength there) at the two places where it is 0.44 and 0.47 dB low at the slant. That calculation is not made for the three roofs. At 75°, nearly two octaves lower across the edges, the solver is 0.37 to 0.52 dB high over the three roofs in the 63 Hz band and 0.61 to 0.66 dB high in the 125 Hz band, and within 0.41 dB in every other case and band in free space; with a roof under the source within 0.32 dB, and with a screen on a roof within 0.31 dB.
On the rigid ground, with ends from half a metre below the tops to half a metre above them or 1.5 m above the ground, the two roofs are within 0.85 dB of the wave calculation at 30°, 1.26 dB at 60° and 1.21 dB at 75° (across the row: 0.74 dB). The three screens are up to 3.21 dB low at 30°, 5.78 dB at 60° and 8.18 dB at 75°, and up to 0.65, 0.49 and 2.39 dB high (across the row up to 3.42 dB low); what lacks between rigid screens is described below.
What it does not hold:
Rigid screens on a rigid ground. Over three screens 6 m high and 5 m apart the solver is up to 1.26 dB low near grazing incidence, 2.55 dB with the source 4.5 m below their tops and 3.42 dB with the listener at street level (two roofs with a gap 2 m wide between them near grazing incidence: within 0.50 dB; one screen, one roof and a roof with a screen 1 m past it: within 0.65 dB), and at a slant up to 3.21 dB low at 30°, 5.78 dB at 60° and 8.18 dB at 75°. Between rigid screens on a rigid ground sound goes to and fro, and a march one way has none coming back. That is part of what lacks: with both ends at street level the wave calculation’s response across the row holds 22 to 29 % of its energy 9 to 60 m after the shortest way and the solver’s 0.1 to 0.2 %, and without that late sound the wave calculation’s own levels are up to 1.74 dB lower across the row, 2.14 dB at 30° and 2.62 dB at 60° (at 75° that is not traced). It is not all: in the 63 Hz band across the row the solver is 3.4 dB low there, where the wave calculation’s level does not fall without its late sound, and the cause of that is not traced.
A row at a slant that neither way takes. The second way is for a rigid ground and edges in one direction. On a ground with an impedance, or with edges at different slants, a row has the first way alone and is refused where an end’s way to it, or its image’s in the ground, is steep, or an edge in it that a march lights is turned more than 60° (one that both ends light themselves: 75°). Edges turned more than 75° are refused either way: neither is measured beyond. Edges at different slants are each taken as if the row’s other edges were turned as it is, which gives the same sound from either end but is not measured against a reference. The second way does not reach a row that the sound crosses at wavenumbers below the solver’s lowest, where the ends are few wavelengths apart across the edges: with a way of 25 m at 75°, 6.8 m across the edges, the 63 and 125 Hz bands. And it takes time: 7.5 times as long as the first way over the 66 cases at 30 and 60°. A barrier’s strip at a slant takes more terms where the ends are close to it: with both ends halfway up the barrier it is solved from 0.14 of its height from it across it, from 0.41 along the way at 60° and from 0.83 at 75°, and closer the edges’ terms stand in its place. The strip’s sum for ends apart along the barrier takes 1.7 to 4.9 times as long as across it up to 45°, 2.5 to 9.9 times at 60° and 5 to 37 times at 75° (eight places, 63 to 500 Hz), the most with the ends 4 and 6 m from a barrier 3 m high: 1.8 to 5.4 s a frequency at 75°.
What stands behind an end. It does nothing: a wall behind a source reflects nothing, and a roof under an end goes on behind it without end. Against the exact solution for the corner, with a source on a roof and a listener 1.5 m above it 20 m on: with the roof’s edge 5 cm behind the source the 63 and 125 Hz bands are 2.6 and 2.0 dB too high (3.5 dB at the edge itself), with the edge 20 cm to 1 m behind it up to 1.2 dB too high or 0.9 dB too low, from 1.5 m on within 0.35 dB, 5 m behind it within 0.03 dB.
An end the march does not reach. A march begins from its end’s field on the plane of its first obstacle, from the top there up to the upper end of the first Fresnel zone of the way on, and the solver refuses (
OutOfReach) an end for which that needs more than eight times the march’s usual absorbing layer: an end level with its first top and closer to it than 3.7 cm (63 Hz band) to 3.9 cm (500 Hz band); one whose way to its first top, or whose image’s in the ground or in the roof under it, rises too steeply, in the 500 Hz band beyond 88.2° from an end a metre before a wall and 87.4° from one 10 cm before it, in the 250 Hz band beyond 89.1° and 88.7°, in the 125 Hz band 89.6° and 89.4°, in the 63 Hz band 89.8° and 89.7°; and one close before an obstacle and high above its top (10 cm before it: more than 2.6 m above in the 500 Hz band, 5.2 m in the 250 Hz band, 10.5 m in the 125 Hz band). On a rigid ground, an end half a metre from the foot of a wall is refused in the 500 Hz band where the wall is 15 m high or more (12 m high: taken), and in the 250 Hz band too where it is 60 m high; 2 m from the foot of a wall 60 m high it is taken in every band. A source a metre above a roof is refused 10 cm before a barrier 3 m high on the roof in the 500 Hz band (30 cm before it: taken) and 5 cm before it in every band. Ends closer to each other over the tops than half a wavelength of the band’s lowest frequency (3.6 m in the 63 Hz band, 0.46 m in the 500 Hz band) are refused too: the march’s field becomes a point source’s by the length of the path, which holds from there on (a tenth of a wavelength apart the level would be up to 0.5 dB off). The solver refuses, with aValueError, an end below the top of a building it stands in or of a wall or a barrier it stands against.A ground that changes before the first obstacle, a roof under both ends with nothing on it between them, and nothing between the ends. That end’s march begins at the end itself, with the parabolic equation’s own starting field, which is the end’s within some 35° of the horizontal and from about a wavelength on. Beyond that the end is refused (
OutOfReach): where its way on, or its image’s in the ground or the roof, is steeper than 35°, and where its first top, or the other end with no top between them, is closer than a wavelength of the band’s lowest frequency (7.3 m in the 63 Hz band, 0.9 m in the 500 Hz band). Within those limits the solver is within 0.49 dB of the paths over a screen behind a change of the ground (at 35° a wavelength away; 0.25 dB up to 20°) and 0.31 dB of the direct sound and the reflection with nothing between the ends (0.35 dB over a roof under both). Without the limits such a march is 1.0 dB low at 50° and 5 dB at 75° behind one screen, and up to 1.0 dB low a quarter of a wavelength before a barrier on a rigid ground. A strip of another ground narrower than 25 cm before the first obstacle can go unseen.An end within decimetres of a top. Just past a top the field changes over less than a cell of the march’s grid of heights, so the march that arrives at an end runs on cells of half the end’s distance from the nearest top at most (down to an eighth of the usual cell). With an end 5 cm to 0.8 m before a screen in free space and up to 0.4 m below or above its top, the level is then between 0.49 dB below the exact solution and 0.34 dB above it. In the shadow it is low throughout: in the 63 Hz band by up to 0.48 dB at 5 and 10 cm, 0.40 dB at 20 cm and 0.25 dB at 0.8 m, in the 500 Hz band by up to 0.32, 0.28, 0.22 and 0.13 dB; finer cells still do not change that, and the cause is not traced.
The tops’ place in the march’s cells. The level moves with a top’s place within the march’s cells, a tenth of the band’s shortest wavelength high, and is lowest with the top in the middle of a cell: by up to 0.08 dB where the sound turns by 40° at the top, and by up to 0.19 dB where it turns by 80 to 115° or an end stands within decimetres of the top.
A wall given as a building. A building’s wall is a screen to the march and its two corners shed as a roof’s, however narrow the roof: a wall given as a building a millimetre thick comes out between 0.41 dB below and 0.09 dB above the same wall as a barrier (below it, by 0.14 to 0.41 dB, in five of six places in its shadow).
Barriers lower than a wavelength on a rigid roof or ground. The edges’ terms take a barrier for a half-plane, lit by the end and by its image in the surface it stands on. The sound that goes on between its top and that surface is not in them, nor in the four paths of the edge integral. With a barrier 0.1, 0.3, 0.5 or 1.1 m high on a roof under both ends (the source 0.5 to 8 m before it, a centimetre, 0.5 and 1.5 m above the roof, twelve places; the listener 5 m past it and 1.5 m up), the four paths are up to 3.20 dB from the exact level of the strip that the barrier makes with its image in the roof (
validation/barrier_strip.py) at 0.1 m, 2.41 dB at 0.3 m, 2.10 dB at 0.5 m and 1.79 dB at 1.1 m. The solver takes that strip for a barrier alone between the ends on a rigid ground, or on a rigid roof under both, and is within 0.20 dB of the exact level in those places (0.13 dB from 0.5 m on), where the march alone is between 8.74 dB below the wave calculation and 1.34 dB above. It is within 0.59 dB of the wave calculation, whose barrier is a cell of 2 cm thick: the thin barrier’s exact level is itself up to 0.58 dB from the wave calculation’s (0.20 dB in the 63 Hz band). A barrier a millimetre high, half a metre past a source half a metre above the roof, leaves the level 0.46 dB below that without it in the 63 Hz band and within 0.18 dB in the others, where the edges’ terms would leave it 2.15 dB above in the 63 Hz band: the strip sheds less than 0.02 dB there, and the rest is the march’s, which begins at the barrier (with the source 3 m before it, 0.12 dB). The edges’ terms stand, with what they lack, for a parapet on a roof’s edge, for a barrier with anything else between the ends or on a ground with an impedance, for a wall given as a building, above a height of 32 over the wavenumber, where the strip’s sound and theirs are within 0.13 dB of each other (nine places), and with the two ends closer to each other than about a quarter of the barrier’s height, both within about a twentieth of its height from it at whatever heights, or between the two (about where six times the height over the distance between the ends and the height over the farther end’s distance from the barrier come to more than 30 together), where the strip’s equation would take more terms than the solver gives it: half a metre above the ground and 39 cm either side of a screen 3 m high they are 0.25 dB from the strip’s level in the 63 and 125 Hz bands (0.83 dB at 44.5 Hz alone), up to 0.26 dB in a band at fourteen such places beside screens 3 to 20 m high, at four of which one end is two to three and a half times as far from the screen as the other, and up to 0.27 dB at twenty-three places with the ends at different heights, both 2 to 4.5 % of the screen’s height from it. A parapet 0.1 to 1.1 m high on the edge of the roof under the source, from the same twelve places, with the listener 5 m past the edge, 3 m below the roof or 1 m above it, is within 0.73 dB of the wave calculation where it is a quarter of a wavelength high or more and 1.28 dB below that (0.15 dB with no parapet); a parapet a centimetre high on the edge, 8 m from the source, leaves the level up to 0.66 dB above the exact corner’s (63 Hz band). With a screen 5 cm high on grass the level is up to 0.50 dB from the open ground’s with the edges’ terms (a source on the grass; 0.45 dB with it 1.5 m up), and 0.23 dB without them.Steps. Over a step of 1 m between two roofs the 63 Hz band is 0.38 dB low (over a step of 0.2 m within 0.02 dB there, and up to 0.22 dB low in the 250 Hz band); the cause is not traced. A roof that rises by a centimetre where the roof under the source ends comes out 0.27 dB above the flat roof in the 63 Hz band with the source 8 m before the step and 0.38 dB with it 3 m before.
Absorbing roofs and walls, which the solver takes as rigid, and the bands above 500 Hz are not in the check.
tests/test_rows.py holds, on every change: thirty-one of the cases against their
stored wave levels, the thirteen in free space also at least twice as far from them
without the edges’ terms, and two more, with a barrier 10 cm high on a roof, within 0.25
dB of the strip’s exact levels and, with the edges’ terms in the strip’s place, as far
off as those are; one rigid screen in free space and on a rigid ground against the exact
solutions as above, with ends far below its top, close beside it and within centimetres
of it, and within 0.2 dB for a source and a listener up to 3 m above its top and 2 m
below; the higher grid behind a high wall and the finer cells past a top, each against
the exact solution with it and without; one, two and three screens level with both ends,
which let through a half, a third and a quarter of the free field without a reflection
at their tops, within 2 %; a march from a point source’s exact field against that field
further on, and the direct sound and the reflection off the ground each by its own
distance; the same sound with the source and the listener swapped, over a ground that
changes along the way and close under walls too; an end over a roof before the roof’s
corner, down to 10 cm from it, and before a barrier on the roof, down to 20 cm, a
barrier on a roof far from both ends and a roof’s edge behind an end, against the exact
solutions as above; the march over a barrier on a rigid plane against the sound without
the barrier plus what Kirchhoff’s screen sheds, the strip’s sound against the edges’
terms where the one hands over to the other, within 0.15 dB, and where the edges’ terms
stand for a barrier (a parapet on a roof’s edge, two barriers, a wall given as a
building, a ground that is rigid at some frequencies only, the ends close to each other
beside a high screen); what a corner sheds of the wave of an end over its roof and of
that end’s image against closed forms; the errors for what the solver refuses, and
marches from an end at the limits of what it takes; and a level that changes by less
than 0.05 dB a centimetre as a barrier’s top passes the plane of the roof before it. At
a slant: one screen, a roof’s corner, a high screen and seven barriers on a rigid ground
against the exact solutions as above, each further off when not turned; four rows in
free space against their stored wave levels at 60°, two of them at 30° too, each further
from them when not turned; the same sound with the ends swapped, with edges at different
slants too; the row from roof level to street level at 60° refused by the first way, 6.4
dB off without that refusal, and taken by the second; what the slants have to be; and
the geometry of an edge at a slant against the shortest way over it, found by a search.
Across the row and moved: the weights against an arrival’s place and size at the slant,
before the shortest way and past the kernel’s end; the weights below the lowest
wavenumber solved, and the refusal; a free field and its reflection moved to slants of 3
to 80° with a solver that gives exact arrivals; the wavenumbers and the row that the
solver is asked for, and those it refuses; which way the solver takes, and both
refusals; one screen and a screen and a barrier on a rigid ground against the exact
solutions; rows on a ground against their stored wave levels at 30 and 60°, three
screens among them; and the same sound with the ends swapped. tests/test_strip.py
holds the strip’s solution by itself: a barrier far lower than a wavelength against the
plate across a uniform flow that it is, the kernel’s parts against each other and their
limits, the rule for the logarithm against closed forms, the equation at the far end of
the sum over the wavenumbers, where a factor of its kernel would grow beyond the digits
of a number and is faded, how far the density’s number of terms holds what the barrier
adds (to 6e-5 of it, 4e-5 dB, at a height of 31 over the wavenumber with one end at the
barrier’s foot and the other far off, the least of the places tried), the sums against
the field of an end millimetres from the barrier, the sum over the wavenumbers along the
barrier against a point source’s field, the same sound with the ends swapped, the sound
shed against a reference written apart (validation/barrier_strip.py: every term of the
density, the kernel as it stands, the sum over the real wavenumbers), and, for ends
apart along the barrier, the sum against a point source’s field, the sound shed against
that reference at slants of 15 to 75°, the sum’s points behind a barrier 31 over the
wavenumber high against three times as many for waves that cross the strip twice as
often, a slant that tends to none against the sound across the barrier, and where the
strip’s equation is not solved at a slant.
Levels over a long term
validation/long_term.py checks how the engine combines weather classes and the
periods of the day (see Levels over a long term).
The scene is a source 1 m over grass (Miki’s impedance, 200 kPa s/m²) with the same
sound power in every octave band, and listeners 1.5 m up from 50 to 800 m away along
the wind, in four weather classes with shares of the day, the evening and the night as
a weather statistic might give them:
class |
weather |
day |
evening |
night |
|---|---|---|---|---|
downwind |
|
30 % |
25 % |
15 % |
upwind |
|
30 % |
25 % |
15 % |
still |
|
40 % |
30 % |
20 % |
inversion |
|
0 % |
20 % |
50 % |
The downwind class is the scene’s own weather, so the four classes take four runs. The level in each class, each period (12, 4 and 8 hours), over the long term and L_den (5 dB in the evening, 10 at night), in dB(A):
downwind |
upwind |
still |
inversion |
day |
evening |
night |
long term |
L_den |
|
|---|---|---|---|---|---|---|---|---|---|
50 m |
47.1 |
36.6 |
47.6 |
47.7 |
46.0 |
46.3 |
46.9 |
46.3 |
53.1 |
100 m |
41.8 |
21.6 |
39.1 |
41.0 |
38.9 |
39.4 |
40.1 |
39.4 |
46.3 |
200 m |
34.5 |
10.5 |
26.5 |
35.8 |
30.1 |
32.0 |
33.8 |
32.0 |
39.7 |
400 m |
24.1 |
-2.8 |
11.8 |
29.5 |
19.2 |
23.9 |
26.8 |
23.9 |
32.5 |
800 m |
12.9 |
-20.2 |
-2.1 |
20.0 |
7.9 |
14.0 |
17.2 |
13.9 |
22.8 |
The arithmetic. The script works the period levels, the long-term levels and L_den out again from each class’s own run: the energy mean over the classes by their shares (ISO 1996-2, CNOSSOS-EU), over the periods by their hours, and L_den by Directive 2002/49/EC. The engine agrees with it to rounding (0.0 dB at most).
The meteorological correction. ISO 9613-2 predicts the level in conditions favourable to propagation, downwind or under a moderate ground-based inversion such as clear nights bring, and takes the long-term level from it as L_LT = L_DW - C_met, with C_met = C_0 (1 - 10 (h_s + h_r) / d_p) beyond d_p = 10 (h_s + h_r) and 0 nearer, where C_0 lies between 0 and 5 dB by the local weather statistics. The engine’s C_met is the A-weighted level in the favourable classes (downwind and the inversion, combined by their shares of the whole day) less the long-term level. With C_0 fitted to it at 3.36 dB, within the standard’s range:
distance |
engine |
ISO 9613-2 |
difference |
|---|---|---|---|
50 m |
1.00 |
1.68 |
-0.68 |
100 m |
2.01 |
2.52 |
-0.51 |
200 m |
3.14 |
2.94 |
+0.20 |
400 m |
3.46 |
3.15 |
+0.31 |
800 m |
3.51 |
3.25 |
+0.26 |
The engine’s correction follows the standard’s shape within 0.68 dB, the most at 50 m, where the standard’s formula is only a step past d_p = 25 m and the ground’s own pattern still differs from one weather to the next. This is a check of plausibility, not of accuracy: the standard’s correction is an empirical fit, and the engine’s comes from each class’s physics, which the sections above check against a fast field program and parabolic equations.
Moving sources against the exact field
validation/doppler.py checks walks with Doppler (see
Moving sources and Doppler). A source
passes a listener 10 m from its line, from 60 m before it to 60 m past, 1 m up with the
listener 1.5 m up, over a rigid ground, at 30 m/s (a car) and 80 m/s (a train), and a
listener passes a source the same way at 30 m/s; the places are 1 m apart. Here the
field is known exactly: the direct sound and the image source’s, each heard at its
retarded time (for a moving source the time t_e it left at, t = t_e + R(t_e) / c; for a
moving listener t - R(t) / c), over the distance then, with the air’s absorption, for
a source that keeps its sound as it moves (quasi-static, as the engine’s). Pure tones
through the engine are compared with it sample by sample (the waveform’s error, the
energy of the difference relative to the field’s) and in 20 ms windows (the level’s
error, mean and most), away from the walk’s ends:
case |
tone |
waveform |
level |
without Doppler: waveform |
level |
|---|---|---|---|---|---|
car, 30 m/s |
250 Hz |
-71.3 dB |
0.000 / 0.000 dB |
2.9 dB |
0.73 / 3.42 dB |
1 kHz |
-58.0 dB |
0.000 / 0.012 dB |
2.9 dB |
0.76 / 3.54 dB |
|
4 kHz |
-46.0 dB |
0.001 / 0.019 dB |
3.0 dB |
0.96 / 4.13 dB |
|
train, 80 m/s |
250 Hz |
-68.7 dB |
0.002 / 0.009 dB |
2.9 dB |
1.62 / 2.75 dB |
1 kHz |
-56.6 dB |
0.006 / 0.034 dB |
2.9 dB |
1.63 / 3.54 dB |
|
4 kHz |
-39.5 dB |
0.077 / 0.419 dB |
3.1 dB |
2.39 / 12.21 dB |
|
passing listener, 30 m/s |
250 Hz |
-71.4 dB |
0.000 / 0.000 dB |
-0.5 dB |
0.22 / 2.87 dB |
1 kHz |
-58.1 dB |
0.000 / 0.001 dB |
1.7 dB |
0.24 / 3.45 dB |
|
4 kHz |
-46.1 dB |
0.000 / 0.005 dB |
2.9 dB |
0.35 / 3.78 dB |
With Doppler the sound follows the field to within 39 dB and its level to within 0.42 dB, both the most for the train at 4 kHz, and there mostly the air’s doing, not the delays’: ahead of the train its tone is heard at 5.2 kHz, which the engine’s band filters share between the 4 and the 8 kHz band, each with its own absorption in the air, where the field here takes the 4 kHz band’s all along. The level differs most where the comparison starts, the train 47 m away. With the field’s absorption taken at the pitch heard instead, through the same band filters (a one-off check, not repeated by the script), the train at 4 kHz is within 44.9 dB and its level within 0.025 dB. The same walks crossfaded from place to place, as without Doppler, keep each place’s pitch, so their phase jumps from place to place: the waveform’s error is about as large as the field itself (-0.5 dB or more). Their crossfades keep each band’s power however alike the places sound, so at 30 m/s the level misses by 0.2 to 1.0 dB on average and by 2.9 to 4.1 dB at most. The train, its places 12.5 ms apart and so always crossfading, misses by 1.6 to 2.4 dB on average and 2.7 to 3.5 dB at most at 250 Hz and 1 kHz; at 4 kHz by 12 dB 0.72 s in, where the field’s two paths cancel for a moment (10 dB below its median level) and the places’ do not.
The sound sent each way. The same walks with the source sending a tone each way
(an Emission, acoustic_spaces.emission): 1 + 0.8 cos θ in amplitude, θ from
straight ahead, and turned in phase by 90° times the sine of the elevation, on a grid
2° apart. In the exact field each path carries what is sent the way it leaves the
source, at the time it leaves:
case |
tone |
waveform |
level |
|---|---|---|---|
car, 30 m/s |
1 kHz |
-57.7 dB |
0.004 / 0.025 dB |
4 kHz |
-47.1 dB |
0.005 / 0.060 dB |
|
train, 80 m/s |
1 kHz |
-56.1 dB |
0.010 / 0.038 dB |
4 kHz |
-35.7 dB |
0.080 / 0.423 dB |
|
passing listener, 30 m/s |
1 kHz |
-57.5 dB |
0.004 / 0.032 dB |
4 kHz |
-46.8 dB |
0.005 / 0.086 dB |
With a cardioid directivity on the source, which the emission takes the place of in the early paths, every number is the same to the digits shown. The level stays within 0.09 dB at 30 m/s and 0.42 dB for the train at 4 kHz, as one signal’s does there; the train’s waveform at 4 kHz is 3.8 dB further than one signal’s, as the tone sent ahead weighs the approach more, where the air’s absorption at the pitch heard differs most from the field’s (with the field’s taken at the pitch heard, as above, it is within 46.6 dB and its level within 0.012 dB). In one-off checks, not repeated by the script, the tone sent louder behind instead (1 - 0.8 cos θ) came within 44.9 dB, and with the amplitude alike every way (only the phase turning) within 39.5 dB, as one signal; a grid 1° apart changed the table by 0.4 dB at most, and places 0.5 m apart brought the cases at 30 m/s within 63 dB and the train at 1 kHz within 60 dB, the train at 4 kHz staying within 36 dB.
The places. The car at 1 kHz with its places further apart:
places apart |
waveform |
level |
|---|---|---|
0.25 m |
-93.8 dB |
0.000 / 0.000 dB |
1 m |
-58.0 dB |
0.000 / 0.012 dB |
2 m |
-38.7 dB |
0.002 / 0.033 dB |
4 m |
-18.3 dB |
0.015 / 0.235 dB |
The delays are curves through the places, so the further apart the places, the more they stray between them; up to 1 m they hardly do.
A helicopter’s places. A source flying over a listener 150 m up at 63 m/s, from 300 m before it to 300 m past, over the rigid ground, the listener 1.2 m up right under its track, as in a helicopter’s flyover, with its places further apart (the level’s windows from 0.3 s after the first sound arrives):
places apart |
tone |
waveform |
level |
|---|---|---|---|
1 m |
250 Hz |
-110.8 dB |
0.000 / 0.000 dB |
1 kHz |
-102.3 dB |
0.000 / 0.001 dB |
|
4 kHz |
-88.5 dB |
0.000 / 0.002 dB |
|
4 m |
250 Hz |
-81.6 dB |
0.001 / 0.015 dB |
1 kHz |
-68.5 dB |
0.002 / 0.047 dB |
|
4 kHz |
-55.3 dB |
0.004 / 0.088 dB |
|
8 m |
250 Hz |
-64.0 dB |
0.003 / 0.094 dB |
1 kHz |
-50.4 dB |
0.006 / 0.202 dB |
|
4 kHz |
-37.2 dB |
0.018 / 0.308 dB |
|
16 m |
250 Hz |
-45.9 dB |
0.013 / 0.819 dB |
1 kHz |
-32.2 dB |
0.025 / 0.490 dB |
|
4 kHz |
-19.4 dB |
0.072 / 0.994 dB |
From 150 m up the delays curve far less than from a road 10 m away, so places 4 m apart follow the field to within 55 dB at 4 kHz, more closely than the car’s places 1 m apart (46.0 dB at 4 kHz); the flyover demo simulates its helicopter every 4 m.
Passing close. The road’s walks again with the walker passing 2 m or 1 m from the other’s line (2.06 and 1.12 m away at the nearest, with their heights), its places 0.25 m apart, heard in mono; at 1 kHz through a cardioid microphone aimed level at the walker’s line; and at the ears of a listener facing along that line, whom the walker passes on one side (the spherical head; the worse ear’s waveform, the level’s error over both). At 70 m/s the walker goes 1.4 m in 20 ms, so here the level’s error is in 5 ms windows:
walker |
from the line |
tone |
waveform |
level |
|---|---|---|---|---|
source, 70 m/s |
2 m |
1 kHz |
-67.8 dB |
0.002 / 0.010 dB |
4 kHz |
-52.9 dB |
0.022 / 0.128 dB |
||
1 kHz, cardioid |
-65.2 dB |
0.002 / 0.010 dB |
||
1 kHz, ears |
-55.5 dB |
0.002 / 0.058 dB |
||
4 kHz, ears |
-47.6 dB |
0.023 / 0.129 dB |
||
source, 70 m/s |
1 m |
1 kHz |
-56.1 dB |
0.002 / 0.010 dB |
4 kHz |
-44.2 dB |
0.023 / 0.130 dB |
||
1 kHz, cardioid |
-53.3 dB |
0.002 / 0.023 dB |
||
1 kHz, ears |
-48.9 dB |
0.002 / 0.020 dB |
||
4 kHz, ears |
-41.1 dB |
0.024 / 0.130 dB |
||
source, 30 m/s |
1 m |
1 kHz |
-56.6 dB |
0.000 / 0.011 dB |
4 kHz |
-45.1 dB |
0.001 / 0.034 dB |
||
1 kHz, cardioid |
-53.6 dB |
0.000 / 0.032 dB |
||
1 kHz, ears |
-48.4 dB |
0.001 / 0.033 dB |
||
4 kHz, ears |
-41.8 dB |
0.001 / 0.105 dB |
||
listener, 30 m/s |
1 m |
1 kHz |
-56.8 dB |
0.000 / 0.008 dB |
4 kHz |
-45.3 dB |
0.001 / 0.026 dB |
||
1 kHz, cardioid |
-53.8 dB |
0.000 / 0.029 dB |
||
1 kHz, ears |
-50.1 dB |
0.000 / 0.038 dB |
||
4 kHz, ears |
-41.4 dB |
0.001 / 0.045 dB |
A path’s spreading is not in its filter: each sample is divided by the path’s delay then, so the level follows one over the distance through the pass. In mono at 70 m/s the most is not at the pass but where the comparison starts, 33 m before it, and is the air’s again: the 4 kHz tone is heard at 5.0 kHz there. With the field’s absorption taken at the pitch heard (a one-off check), the level at 70 m/s is within 0.028 dB at 4 kHz and 0.009 dB at 1 kHz, the most at the pass.
What depends on the direction a path arrives from (a microphone’s pattern, the ears, a loudspeaker’s panning, the source’s directivity) stays in the filter, which is known at the places and goes in a straight line from each to the next, taken when each place’s sound is heard however many of them go by in 20 ms. Through the cardioid microphone (each path times 0.5 + 0.5 cos of the angle it arrives at) the level stays within 0.032 dB of the field’s in 5 ms windows. A straight line between two places 0.25 m apart strays from the pattern by 0.026 dB in the direct sound 1.12 m from the capsule (by hand: an eighth of the step squared times the pattern’s curvature over its value).
At the ears a walking source’s field is exact too, for ears whose responses depend on the direction alone, as the engine’s do: the head stands still, so each sample of the pressure at its centre goes through the ears’ responses to the direction it arrives from, and the responses add up where they land. The engine keeps where each ear’s response starts as a delay and takes what passed the head’s centre that much earlier (see Moving sources and Doppler). The level stays within 0.06 dB at 1 kHz, the most 1.9 m after the pass at 70 m/s, 2 m away, where the ground’s reflection takes the field 15 dB down. At 4 kHz it is within 0.13 dB: at 70 m/s the most is where the comparison starts, as in mono (0.13 dB there too), at 30 m/s (0.105 dB) the far ear’s 0.3 m before the pass, the field 12 dB down. With the places 0.125 m apart the 0.06 dB at 1 kHz and this 0.105 dB are 0.015 and 0.034 dB (a one-off check, not repeated by the script), so they come mostly from the straight line between the places. A walking listener’s head moves through the field, which has no exact solution of this kind: its rows compare the engine with its own model worked out sample by sample, each ear a point its onset further along the path at the moment it hears, and what arrives there through the rest of the ear’s response.
Formats of many channels turn faster with the direction than a cardioid does. In a one-off check, not repeated by the script (a source passing 1 m from the listener at 70 m/s, the direct sound alone, 1 kHz, against the field through the format’s gains for the direction at each instant), third-order Ambisonics differed from the field by 1.3 % of it over the pass with the places 0.25 m apart (14° apart at the pass, as the listener sees them), by 0.33 % with 0.125 m and 0.08 % with 0.0625 m; panning to 5.0 by 1.5 %, 0.26 % and 0.14 %.
The levels. White noise through the car’s walk over grass (Miki’s impedance, 200
kPa s/m², scattering 0.1, which gives the walk a late part over the open ground), 16
noises up to 18 kHz: the energy of the sound in each octave band over the pass-by,
relative to the source’s, against the noise through each place’s own impulse response
for the time its sound is heard (Doppler moves the sound in time and pitch but keeps its
energy), and against the sound exposure level pass_by gives from the places’ band
levels:
band |
rendered |
responses |
pass-by |
early part alone: rendered |
responses |
|---|---|---|---|---|---|
63 Hz |
-25.89 |
-25.91 |
-26.13 |
-25.90 |
-25.92 |
125 Hz |
-27.53 |
-27.54 |
-27.69 |
-27.62 |
-27.64 |
250 Hz |
-32.11 |
-32.07 |
-32.29 |
-32.31 |
-32.31 |
500 Hz |
-34.87 |
-34.92 |
-34.04 |
-34.97 |
-34.91 |
1 kHz |
-29.52 |
-29.53 |
-29.63 |
-29.56 |
-29.59 |
2 kHz |
-30.18 |
-30.19 |
-30.28 |
-30.21 |
-30.23 |
4 kHz |
-30.75 |
-30.77 |
-30.68 |
-30.78 |
-30.79 |
8 kHz |
-31.81 |
-31.81 |
-31.85 |
-31.82 |
-31.82 |
The sound keeps the energy of the responses to within 0.07 dB in every band, with its late part and without. The late part is crossfaded by weights that add up to one, as the car sends its sound, drawn from one random sequence for every place; the responses here are drawn from the same one, as otherwise their late parts’ chance correlation with the early sound would differ by up to 0.25 dB in a band (a one-off check). The pass-by’s band levels are within 0.24 dB of the sound, 0.8 dB in the 500 Hz band, where the ground’s dip falls: the pass-by takes the places’ band levels, averaged over each band, where the sound is read through band filters, whose skirts fill a dip (a cause not checked separately). For a car at 30 m/s over this grass with 94 dB of sound power, the listener has L_Amax 61.4 dB(A) 2.03 s into the walk, SEL 61.2 dB(A) and L_Aeq 55.2 dB(A) over 4 s.
What it leaves out. The engine’s source is quasi-static, as the field it is compared with: a moving source’s convective amplification is left out (its size depends on the kind of source: a point monopole’s far-field pressure goes as (1 − M cos θ)⁻², M cos θ its Mach number towards the listener as the sound leaves, so its level as 40 lg 1/(1 − M cos θ), up to 1.6 dB louder straight ahead of it at 30 m/s and 4.0 dB at 70 m/s, 1.5 and 3.2 dB quieter straight behind), and so is the Doppler shift of the late part, which is crossfaded. At the ears what is left out is the amplification at the head’s centre: each ear keeps its own Doppler factor over the centre’s, as the exact field above has it (up to 0.15 dB at an ear at 70 m/s, 1 m away, a one-off check). The ears’ responses depend on the direction a sound arrives from, not on how far its source is: one passing 1 m away is heard through the responses of a far one. A walking source is checked against the exact field above; a walking listener’s moving head has none, and is checked against the engine’s model worked out sample by sample, as above; and both against the convolution with a response when the walker stands still (to within 45 dB at each ear in the tests). A test drives a source past a listener whose ears’ responses start 4 samples apart from one direction to the next, as a measured set’s may, and holds its treble (6 to 16 kHz, frame by frame) within 0.3 dB of the same walk with ears that start together.
Helicopter rotors against theory and a certified level
validation/rotorcraft.py checks the sound a helicopter’s rotors send (see
Helicopters): its tones against Gutin’s formula and against
the far field summed over the blades in two other ways, the store that keeps them,
the airfoil self-noise against the sample outputs of its authors’ code, the blades’
pitch against its closed form, Pegg’s broadband noise against his worked example, and
the whole, with either broadband noise, against the certified noise level of the
helicopter it describes, the AS350 B3, flying at 63 m/s (25 °C).
The tones. Each harmonic of the blade passing frequency, against:
Gutin’s (1936) formula for a hovering rotor whose thrust and torque act on one radius, in 18 directions from the axis;
the far field’s integral over a turn, summed numerically with 4,096 instants a turn over the blades’ points where they truly are, each a moving force (the lift and the drag) or a source (the thickness) on its straight chord, in 24 directions;
Farassat’s formulation 1A in time, the same points each heard at the time it left (solved by Newton’s method) at an observer 20,000 km away in eight directions, its harmonics taken from 1,024 instants a turn. This check shares nothing with the closed form but the blade’s loads.
check |
rotor |
harmonics |
most off |
|---|---|---|---|
Gutin |
3 blades, 41.3 rad/s |
6 |
3 x 10⁻¹⁵ |
the integral round the turn |
main |
12 |
6.5 x 10⁻⁷ |
tail |
12 |
1.7 x 10⁻⁴ |
|
in time (Farassat 1A) |
main |
12 |
7.5 x 10⁻⁶ |
tail |
12 |
1.6 x 10⁻⁵ |
“Most off” is the largest difference of a harmonic’s complex amplitude, over that harmonic’s loudest in any direction (over the loudest harmonic in the direction, in time). The tail rotor’s 1.7 x 10⁻⁴ comes from the chord’s points’ radius, taken to second order: its chord is a fifth of its radius. In time the observer stands so far away that the blade’s radius squared over twice the distance, which the far field leaves out of the phase, does not count: in a one-off check at 200 km it put the main rotor 7.5 x 10⁻⁴ off, at 2,000 km 7.4 x 10⁻⁵, falling as one over the distance.
The store. A rotor’s tones are kept as one period of the sound in each direction
on a grid (Periodic); what it sends over 4,000 samples 8.3 s in, each sample a
random direction, against the harmonics summed there:
rotor |
grid |
harmonics |
rms error |
size |
made in |
|---|---|---|---|---|---|
main |
5° |
33 |
-44 dB |
11 MB |
2.6 s |
2.5° |
33 |
-56 dB |
44 MB |
8.4 s |
|
tail |
5° |
31 |
-48 dB |
11 MB |
1.8 s |
2.5° |
31 |
-59 dB |
42 MB |
5.6 s |
The harmonics kept reach 90 dB under the loudest (QUIET_DB). The default grid is 5°
apart.
Pegg’s example. Pegg’s example I (NASA TM-80200, 1979), a hovering transport helicopter heard 61.6 m from its main rotor, 5° under its disc, and 62.2 m from its tail rotor, 10° off its axis: the broadband levels come out at 84.50 + S and 82.49 + S dB (his 84.5 and 82.5), and the peak frequencies at 289 and 545 Hz (his 289 and 544).
Airfoil self-noise. Brooks, Pope and Marcolini’s report (NASA RP-1218, 1989) gives two sample outputs of its code: one untripped segment of a 30.48 cm chord at 1.516° (table D2), and ten tripped segments of 15.24 cm at 5.4° with a rounded tip (D3), both in a 71.3 m/s flow heard 1.22 m away. Each mechanism’s band levels from 100 Hz to 40 kHz, against the tables:
table |
mechanism |
most off |
|---|---|---|
D2 |
turbulent boundary layer: pressure side, suction side, angle of attack |
0.006, 0.006, 0.008 dB |
laminar boundary layer’s vortex shedding |
0.003 dB |
|
total |
0.006 dB |
|
D3 |
turbulent boundary layer: pressure side, suction side, angle of attack |
0.006, 0.006, 0.006 dB |
tip vortex at 7.7° |
0.188 dB |
|
tip vortex at 7.668° |
0.006 dB |
The tables are rounded to 0.001 dB. The tip vortex column is the code’s equations at a tip angle of 7.668°, not at the 7.7° of the table’s input; the code as the report prints it gives 7.7°’s levels, 0.19 dB over the table at 100 Hz and 0.04 dB under it at 40 kHz, so the table may come from another version of it. Neither table has the trailing edge’s bluntness or a stalled section. In one-off checks for the AS350 B3 at 63 m/s, straight down, the bluntness adds under 0.05 dB (its 0.5 mm trailing edges send theirs around 20 kHz) and the 1.5 % of the places round the turn where a section stalls nothing to 0.001 dB; the turbulent boundary layers give 106.8 of the main rotor’s 107.5 dB 1 m away, and the laminar boundary layer’s vortex shedding 3 dB of the tail rotor’s 89.4. The directivity’s angles are those of the report’s figure B3: theta from the chord to the observer, phi from the span to the observer’s projection across the chord.
The blades’ pitch. The collective and cyclic pitch that carry the trim’s thrust with no flapping, for the main rotor’s rigid blades taken from the hub to the tip (no root cut-out and no tip loss, so that it has a closed form), twisted by -10°, in an even inflow, against Johnson’s closed form (Helicopter Theory, 5.6):
speed |
theta_0 |
theta_1s |
most off |
|---|---|---|---|
0 m/s |
15.5675° |
0° |
9 x 10⁻¹² ° |
30 m/s |
13.2553° |
-1.7615° |
7 x 10⁻¹² ° |
63 m/s |
14.5351° |
-3.9524° |
1.5 x 10⁻¹¹ ° |
tests/test_rotorcraft.py checks the blade sections’ sum (bpm_bands) against one
done place by place, each section’s frame and motion through the air taken from the
disc’s own vectors, each mechanism’s level with its own directivity and its bands
moved one by one, hovering and at 63 m/s, to 10⁻⁹. In one-off checks against 2,304
places round the turn, the default 144 hold the main rotor’s level, on the 5° grid, to 0.01 dB
everywhere below the horizon and to 0.7 dB above it, close to its disc’s plane. The
tail rotor’s disc is upright, so listeners below the helicopter are close to its
plane: there its level holds to 1.3 dB (0.6 dB with 288 places, 0.3 dB with 576),
because BPM’s directivity changes abruptly where a section’s chord points at the
listener, an angle where the report itself finds it inaccurate. The tail rotor’s
broadband noise of this kind is 36 dB under the helicopter’s sound in the
certification’s overflight (below). 48 sections instead of 24 changed the levels by
under 0.06 dB.
The certified level. The AS350 B3 at its maximum mass of 2,250 kg flying the overflight of ICAO Annex 16, chapter 11 (14 CFR part 36, appendix J): level, 150 m over a microphone 1.2 m above grass, at 0.9 V_H, in still air at 25 °C and 70 % humidity at sea level. The main rotor turns at 394 rpm, the most in powered flight of the AS350 B3 with the Arriel 2B engine (its type certificate data sheet, EASA.R.008, 9.1): the rotor speed appendix J flies (J36.3(c), J36.105(c)(2)) for that variant’s noise record, D73, which certifies 84.6 dB(A) at 2,250 kg. The type certificate data sheet for noise (EASA.R.008) gives no airspeed; V_H is taken as Airbus’s fast cruise speed, 136 kt, so 63.0 m/s. The direct sound and the ground’s reflection (Weyl and van der Pol’s, with Miki’s impedance of 200 kPa s/m²), each heard at the time it left the helicopter with the air’s absorption (ISO 9613-1), A-weighted; the slow time weighting finds the points 10 dB under the most, and the sound exposure level is the energy between them:
part |
SEL |
L_ASmax |
10 dB down for |
|---|---|---|---|
all |
88.0 dB(A) |
81.7 dB(A) |
9.4 s |
main rotor’s tones |
63.3 dB(A) |
55.6 dB(A) |
8.9 s |
tail rotor’s tones |
79.8 dB(A) |
72.4 dB(A) |
10.8 s |
main rotor’s broadband noise |
87.3 dB(A) |
81.5 dB(A) |
7.9 s |
tail rotor’s broadband noise |
64.9 dB(A) |
57.8 dB(A) |
11.0 s |
certified |
84.6 dB(A) |
That is with Pegg’s broadband noise, the default. With each blade section’s own
(broadband="bpm"):
part |
SEL |
L_ASmax |
10 dB down for |
|---|---|---|---|
all |
80.1 dB(A) |
72.4 dB(A) |
12.0 s |
main rotor’s broadband noise |
68.6 dB(A) |
62.2 dB(A) |
8.4 s |
tail rotor’s broadband noise |
44.3 dB(A) |
37.4 dB(A) |
10.2 s |
With Pegg’s noise the model is 3.4 dB louder than the certified level, nearly all of it
Pegg’s broadband noise of the main rotor; with the blade sections’ own it is 4.5 dB
quieter, nearly all of it the tail rotor’s tones, the main rotor’s broadband noise 19 dB
under Pegg’s. Self-noise is the noise of a blade in a smooth flow: it leaves out the
blades cutting through the wake of those ahead and through turbulence, which a full-size
rotor in flight makes and which Pegg’s fit to measured rotors holds. Pegg’s method is a
correlation of the 1970s’ measurements: in his own example the band of the broadband
peak (315 Hz) comes out 5.3 dB over the level measured there, though a tone of the tail
rotor in that band is over it alone; the bands where only the broadband noise counts
have no measured level in the report. The tones leave out the loads that change round
the turn, which make a rotor’s lower harmonics in forward flight louder than steady
loads do. Some of the AS350 B3’s inputs are assumed (the main blades’ chord and twist,
the tail rotor’s chord and thickness, V_H); AS350_B3’s source code says which.
Sirens and road vehicles against their rules
validation/urban_sources.py holds the pass-by demos’ police car’s siren, the fire
engine’s siren and air horn, the car’s horn and the train’s horn
(acoustic_spaces.demos.siren, acoustic_spaces.demos.horn,
see Vehicles passing by) against what the rules for
sirens and horns ask, with the siren’s directivity table in the engine, and compares
the car’s sound power by the two versions of CNOSSOS-EU’s table.
The siren’s level and directivity are those the National Bureau of Standards measured
on a commercial 100 W electronic siren (SP 480-28, 1978): 118 dB(A) 3 m away on its
axis, its yelp averaged over 20 s, 112 dB(A) 50 degrees off it and 107 at 90.
California’s rule (California Code of Regulations, title 13, section 1028): the least A-weighted levels of its two classes of siren 3.0 m away from 0 to 50 degrees off the axis (table I), the wail and the yelp as the engine gives them there over a ground that takes all the sound:
degrees off the axis |
0 |
10 |
20 |
30 |
40 |
50 |
|---|---|---|---|---|---|---|
class A, least (dB(A)) |
120 |
119 |
118 |
117 |
115 |
113 |
class B, least (dB(A)) |
115 |
114 |
113 |
112 |
110 |
108 |
wail and yelp (dB(A)) |
118.0 |
116.8 |
115.6 |
114.4 |
113.2 |
112.0 |
The siren is above class B at every angle and 1 to 2 dB under class A: a class B siren by the rule. The rule takes the average of five peaks of the sweep, NBS the energy over 20 s, so the rule’s reading of the same siren would be at least as high. Its level on the axis is highest in the 1 kHz octave band, as the rule asks (1 or 2 kHz), and the wail’s level in 125 ms falls 2.2 dB(A) within its cycle, where the rule allows 10 dB(A) under the table. That fall comes from the A-weighting of a sweep from 500 to 1500 Hz through a loudspeaker taken to be flat: the loudspeaker’s response is not in NBS’s report.
The Swiss rule for priority vehicles’ two-tone horns (SR 741.41, annex 11, the values of DIN 14610): the two tones, 440 and 586.7 Hz, lie within the base frequencies of 360 to 630 Hz, a fourth apart (the rule: 3:4, -3 to +7 %), with a cycle of 3 s (2.5 to 3.5 s) and no pause. On the axis 2 m away in a free field they give 119.4 dB(A), where the rule asks 116 to 129 dB(A) on the test bench; 7.00 m in front of the police car’s siren, taken at the car’s front, 1.5 m up, over the street’s asphalt, the engine gives 108.1, 108.7 and 110.8 dB(A) 0.5, 1.0 and 1.5 m up, where the rule asks 100 to 115 dB(A) on the vehicle. The level of the two tones follows from the yelp’s sound power, the same in all, as the loudspeaker is taken to send each pattern with one drive: 128.6 dB(A) against the yelp’s 130.6.
The fire engine. Its siren plays the same two tones 6.0 dB louder, 3.0 m up on its cab’s roof, which the demo takes as loud as the Swiss rule lets two tones be on a vehicle. The engine gives them 112.3 to 114.9 dB(A) 7.00 m in front of the siren, which the demo takes to be at the vehicle’s front, over the street’s asphalt, every 0.1 m from 0.5 to 1.5 m up, the loudest 0.8 m up (the rule: 100 to 115 dB(A) 7.00 m in front of the vehicle; a siren set 0.5 to 2 m back on the roof gives 0.4 to 1.4 dB less there), and 125.4 dB(A) 2 m away on the axis in a free field (the bench: 116 to 129). Its air horn, 1.2 m up, is held against the rule for vehicles’ horns (Council Directive 70/388/EEC, Annex I): on the rule’s bench, 2 m in front of it on its axis in a free field, a blast gives 118.0 dB(A), the most the rule allows (105 to 118, point 1.2.1.6); between 1800 and 3550 Hz it gives 110.2 dB(A) there, where the rule asks 105 at least, and its loudest component in that band is 6.0 dB over the loudest above 3550 Hz, which the rule asks it to be over (point 1.2.3.1), from the spectrum of the made blast; each blast is at its level 0.05 s after it starts (the rule: 0.2 s at most, point 1.2.1.7); 7 m in front of the vehicle over asphalt, 0.5 to 1.5 m up, it gives 107.9 to 108.6 dB(A), where the rule asks 93 at least (point 2.1.4). The horn’s pitch, its spectrum, its blasts, its height and its directivity are assumptions, as no measured air horn of a fire engine was found; the rule bounds them only as above.
The car’s horn. The street car’s pair of disc horns (--car car_and_horn), at 360
and 430 Hz, 0.5 m up, against the same rule. On its bench, 2 m in front of it on its
axis in a free field, a blast gives 109.9 dB(A) (the rule: 105 to 118; Hella gives its
S77 110 +/- 3, the air over the 2 m taking the last 0.1 dB of the treble); between 1800
and 3550 Hz it gives 107.6 dB(A) there (the rule: 105 at least), its loudest component
in that band 1.9 dB over the loudest above 3550 Hz (the rule: over); each blast is at
its level 0.02 s after it starts (the rule: 0.2 s at most); 7 m in front of the car over
asphalt, 0.5 to 1.5 m up, it gives 100.4 to 101.3 dB(A), the most 0.5 m up (the rule: 93
at least). Its spectrum is a disc horn’s, its harmonics struck alike and shaped by its
tone disc’s resonance at 3 kHz, where a single-disc horn’s main components are (US
patent 8,689,723), with a Q of 2 (assumed); made as the air horn is, a sawtooth at each
fundamental, it would give only 102.8 dB(A) between 1800 and 3550 Hz, under the rule,
which a horn sold as approved meets. Its blasts, its height and its directivity are
assumed.
The train’s horn. The railway train’s warning horn (--horn blasts) sounds the
two notes of the EU’s rule for locomotives and passenger trains (TSI LOC&PAS,
Regulation (EU) No 1302/2014, point 4.2.7.2.1), 660 and 370 Hz (the rule: 660 +/- 30
and 370 +/- 20), one after the other. EN 15153-2:2020, which the rule names for the
level, asks each note sounded alone for 101 to 109 dB(C) (L_pCeq) on the vehicle, 25 m
ahead of the train’s front on its centre line over an open, flat site. Each note is
made to 109 there with the horn 2.2 m and the microphone 1.5 m over the railway
example’s ballast (assumed: the sample of the standard seen leaves out where the
microphone stands, and M. Toward et al., “Sound propagation and audibility of train
horns”, ISVR and RSSB, measured train horns 1.5 m up), each harmonic’s reflection off
the ballast added in pressure and taken out of its sound power. The engine, which
averages a reflection’s interference over each band, gives the high note 108.8 dB(C)
there and the low one 109.0, and 109.6 and 109.1 in a free field. Sounded together as
a chord (--horn chord), which EN 15153-2 allows, the two notes are made to 109 dB(C)
together, its level for a group of horns; the engine gives 108.9 dB(C) there and 109.3
in a free field. Toward et al. measured a train horn of 368 Hz over ballast with the
horn from 0.5 to 3.0 m up and
found virtually no difference at 25 m; the low note’s A-weighted level there changes by
+1.5 to 0 dB over those heights by its harmonics and by +0.1 to -0.5 dB in the engine.
A-weighted, the low note is 2.4 dB under its C-weighted level harmonic by harmonic
(Toward et al. take 2 dB off the rules’ C-weighted levels for their A-weighted ones)
and 1.4 dB under it by octave bands, as the engine weights it; the high note 0.5 and
1.0 dB. Its blasts, its height on the train and its directivity, the measured siren’s,
are assumptions: Toward et al. measured a train horn 1 dB down 30 degrees off its axis,
where the siren is 3.6 dB down, so beside the track the horn may be a few decibels
louder than here.
The car’s table. CNOSSOS-EU’s Table F-1 as amended in 2021, which the road
vehicles take (acoustic_spaces.demos.road), against Directive (EU) 2015/996’s, which
the car had before acoustic-spaces 4.1.0, at 20 °C:
speed (km/h) |
30 |
50 |
70 |
90 |
110 |
130 |
|---|---|---|---|---|---|---|
2021: sound power (dB(A)) |
92.5 |
98.4 |
103.0 |
106.6 |
109.6 |
112.1 |
2015/996 (dB(A)) |
90.4 |
96.0 |
100.4 |
104.0 |
106.9 |
109.4 |
more by 2021’s |
+2.1 |
+2.5 |
+2.6 |
+2.7 |
+2.7 |
+2.7 |
The amendment has the vehicle’s point radiate alike every way, where 2015/996 had it radiate into the half space above the road, and raises the coefficients A. The table is used as published, in the two copies of it checked against each other (the consolidated directive and Germany’s BUB-D 2021): no measured pass-by is compared with it here. Measured pass-bys of 75 medium heavy vehicles in France found the 2015 table’s levels 3 to 6 dB(A) low (Euronoise 2018, paper 210, which gives its measured levels in figures only).
Trains against Schall 03 and the EU’s limits
validation/rail_sources.py holds the pass-by demos’ trains (acoustic_spaces.demos.rail,
see Trains passing by) against Schall 03’s own way of
reckoning their level, and beside the limits the EU sets for new trains. The engine’s
pass is the demo’s: each source’s front point walked along the track every 1 m with
Schall 03’s directivity, its other points that much later and louder or quieter, the
three heights’ energies added; the air at Schall 03’s 10 °C and 70 %. Schall 03’s sum
takes each unit’s sound power per metre of track (equation 1) along the same 200 m of
track in pieces of 0.1 m, each a point with its directivity (equation 8) heard over a
sphere (equation 11) through the air of its Tabelle 17 (equation 12), one train an hour,
the SEL 10 lg 3600 dB over its hourly level. It needs none of what the demo assumes:
not where a unit’s sources are along it, nor how its points share them. Both read the
data sheets through the same code (equation 1, checked against the gazette by
tests/test_rail.py); the directivity Schall 03’s sum writes out itself.
In a free field (a ground that takes all the sound), where EN ISO 3095 measures a pass-by:
train |
speed |
7.5 m, 1.2 m up: engine |
Schall 03 |
25 m, 3.5 m up: engine |
Schall 03 |
|---|---|---|---|---|---|
S-Bahn |
80 km/h |
88.3 |
88.3 |
82.9 |
82.8 |
regional train |
160 km/h |
98.2 |
98.2 |
92.6 |
92.6 |
(SEL, dB(A)); every octave band within 0.01 dB. The pass in the engine holds the sound power Schall 03 gives, wherever along the train the demo puts it.
Over the railway example’s ground (its ballast bed 4 m wide, gravel, and the
meadow’s grass beyond, without its barrier), against Schall 03 with its ground: the
solid angle of the reflection near the source (D_Ω, equation 9, about +3 dB) and the
ground’s attenuation (A_gr,B, equation 14, 0 dB this near):
train |
speed |
7.5 m: engine |
Schall 03 |
25 m: engine |
Schall 03 |
|---|---|---|---|---|---|
S-Bahn |
80 km/h |
87.0 |
91.1 |
80.5 |
84.7 |
regional train |
160 km/h |
97.0 |
100.9 |
91.5 |
94.5 |
The engine gives 3.0 to 4.1 dB(A) less; by octave band, 7.5 m from the S-Bahn, +2.9,
+2.2, +0.8, -2.1, -6.1, -4.3, -1.0 and -2.2 dB from 63 Hz to 8 kHz. The two reckon the
ground in different ways. Schall 03 adds the reflection’s energy, about as much again
as the direct sound’s at every frequency. The engine adds the reflection with its phase
(+6 dB where the two arrive together, at 63 and 125 Hz, a dip where they cancel), off
a ground whose impedance it weighs over the reflection’s Fresnel zone. Traced at 7.5 m
from the S-Bahn: of the 4.0 dB, 0.9 dB is the ballast taking sound where a hard bed
would not (87.9 dB(A) with the bed hard), 1.2 dB is the dip of a point at the rail top
and its reflection in step with each other at 1 to 2 kHz (89.1 dB(A) with the bed hard
and the reflection’s energy added, coherent_max_band_hz: 63), and the last 2.0 dB is
the meadow: up to 2 kHz most of the reflection’s Fresnel zone lies on the grass beyond
the 4 m bed. Schall 03 puts a train’s rolling noise at one point at the rail top; it
comes from its wheels, rails and sleepers, at heights apart, where one point’s dip
would not be as deep.
The TSI’s limits. Each unit of the demo’s trains alone at 80 km/h over the example’s ground, 7.5 m from the track 1.2 m above the rail top: the sound exposure of its whole pass, each of its points walked from 100 m before the listener to 100 m past it (Schall 03’s sum over the same 200 m of track), over Tp, the time the unit takes to pass, its length over its speed (what the script prints as L_pAeq,Tp), beside the limits of Commission Regulation (EU) No 1304/2014 (the TSI Noise, table 4) for new units there:
unit |
Tp |
engine |
Schall 03 |
limit |
|---|---|---|---|---|
electric multiple unit (the S-Bahn, 67.4 m) |
3.03 s |
82.2 |
86.2 |
80 |
electric locomotive (19.0 m) |
0.85 s |
87.7 |
90.4 |
84 |
coach (26.4 m) |
1.19 s |
83.9 |
88.0 |
79 |
freight wagon with composite blocks, not a tank wagon (17.8 m) |
0.80 s |
85.7 |
89.9 |
83 |
(dB(A)). Schall 03’s units are 6.2 to 9.0 dB over the limits by its own reckoning, and 2.2 to 4.9 dB over them in the engine. The limits are for new units on a track of low roughness (EN ISO 3095:2013, 6.2); Schall 03’s levels are for units of the German fleet on rails in average condition, rougher than the TSI’s track. That Schall 03 is over the limits says that, not that either is wrong; no measured pass-by is compared here.
EN ISO 3095:2013 measures a trailer unit, a coach or a wagon, over two identical units one behind the other, from the middle of the first passing to the middle of the second (over Tp), or, as an exception, one unit that is acoustically symmetric, at the end of a train behind a quieter vehicle, from its middle passing until its level is 10 dB under its maximum (over Tp / 2), as S. Radulović et al., “Pass-by noise measurements using one versus two identical trailer units within available standard methods” (RAILCON ‘24, Niš), quote its figures: for a lone symmetric unit, the table’s quantity but for the tail past those 10 dB. In the engine, two of each unit windowed the first way, or one windowed the second, give at most 0.2 dB less than the table; one unit from its front passing to its rear passing, 0.1 dB less for the S-Bahn and 1.1 to 1.7 dB less for the others.
Road works against Defra’s rows and the EU’s limits
validation/plant_sources.py holds the road works demo’s machines and reversing alarm
(acoustic_spaces.demos.plant, see Road works in the street)
against the data they come from and the EU’s limits for outdoor machines. Each machine
is a row of Defra’s noise database for construction sites (2005, the data of BS 5228-1
Annex C), its sound power the row’s level 10 m away plus 28 dB:
machine |
Defra’s row, 10 m away |
its octaves, A-weighted and added |
the engine, 10 m away |
sound power |
|---|---|---|---|---|
breaker (table 1, row 9) |
90 |
90.3 |
90.1 |
118.3 |
generator (table 4, row 87) |
65 |
64.9 |
64.8 |
92.9 |
dumper (table 4, row 4) |
76 |
75.5 |
75.3 |
103.5 |
(dB(A)). Defra rounds its levels to whole decibels. The engine’s is each machine at its height over a hard ground, its reflection added by its energy, heard 10 m away 1.5 m up (Defra gives no height): within 0.2 dB of the octaves’ sum, as a point over hard ground radiating into a half sphere gives back.
The EU’s limits. Stage II of Directive 2000/14/EC (Article 12) lets a new 6 kVA generator (its electric power taken as 6 kW) send 97 dB(A); Defra’s sends 92.9. A wheeled dumper of 75 kW may send 103 dB(A); Defra’s sends 103.5, but Defra’s is the loudest moment of a drive-by on a site and the directive’s a test cycle of its own. The directive’s 103 dB(A) for an excavator of 121 kW is for the excavator without its breaker. Breaking, Defra’s sends 118.3 dB(A); Epiroc guarantees 121 dB(A) for its MB 1650 (by 2000/14/EC, measured to EN ISO 3744), a 1650 kg breaker as Defra’s.
The reversing alarm. In a free field, 1.2 m up facing along its axis, the engine gives 107.0 dB(A) 1.2 m in front of it while it sounds, the 107 of SAE J994 Type B, and 96.0 dB(A) 1.2 m behind it, 11 dB under, as the siren’s directivity it is given has it. Its sound power in the scene is its average over its beeps and pauses, 3.1 dB under its sound power while it sounds (108.6 and 111.7 dB(A)).
No measured site is compared here: Defra’s levels are averages over the machines it measured, and the made sounds’ time structure (the blows, the firing, the beeps’ rate) is assumed.
Aircraft noise against Doc 29 Volume 3
validation/doc29_reference.py holds acoustic_spaces.doc29 (see Aircraft by ECAC
Doc 29) against the reference cases of Doc 29
Volume 3 Part 1 (5th edition, 2026), which ECAC publishes for checking a new
implementation of Volume 2’s method: three hypothetical aircraft (a jet with its
engines on the rear fuselage, one with them under the wings, a turboprop), each
arriving and departing on a straight and a curved route, twelve cases. Volume 3 gives
their levels at 18 receptors (its table B-1, which the package holds), every term of
every segment at those receptors and the levels on a grid (the worksheets B-2 and B-3
of its Part 1 workbook, which --workbook reads).
The levels at the receptors. All 99 within 0.0055 dB of table B-1, which gives them to 0.01 dB; the largest difference of a case is 0.0036 to 0.0055 dB.
The grids. The rms difference δRMS that Volume 3 aims at 0.01 dB or less:
case |
points |
δRMS |
largest |
case |
points |
δRMS |
largest |
|---|---|---|---|---|---|---|---|
JETFAC |
2732 |
0.0029 |
0.0053 |
JETWDC |
3868 |
0.0029 |
0.0059 |
JETFAS |
2750 |
0.0028 |
0.0053 |
JETWDS |
3876 |
0.0029 |
0.0056 |
JETFDC |
3269 |
0.0029 |
0.0063 |
PROPAC |
3042 |
0.0028 |
0.0058 |
JETFDS |
3273 |
0.0029 |
0.0058 |
PROPAS |
3042 |
0.0028 |
0.0056 |
JETWAC |
2929 |
0.0030 |
0.0099 |
PROPDC |
2875 |
0.0030 |
0.0061 |
JETWAS |
2932 |
0.0030 |
0.0100 |
PROPDS |
2870 |
0.0029 |
0.0061 |
(dB.) The grid’s levels are given to 0.01 dB, whose rounding alone is 0.0029 dB rms.
Every segment. Each case has as many segments as Volume 3’s, and each term of its 3516 rows matches to within 0.0014 dB for the baseline level, 0.0008 dB for the speed, 0.0003 dB for the engines’ installation, 0.0013 dB for the lateral attenuation and 0.0014 dB for the start-of-roll directivity; the finite segment correction differs by up to 0.052 dB on a few segments, and their segment levels with it. Two things of Volume 3’s own make those differences, both traced:
Its ground tracks are 0.0019 % short: the routes in metres were converted to feet through nautical miles of 6076 ft (a nautical mile is 6076.1 ft), so a track’s end 100 km out is 1.9 m nearer, and the nodes of a short segment by a turn move by a few tenths of a metre.
It lays the lengths into which eq. 3-3i cuts a climbing or descending segment by speed, which are lengths along the segment, along the ground track instead: its cuts lie up to 7.3 m farther on than the cuts here.
Cut its way, the segments’ places agree within 1.9 m, the finite segment correction within 0.021 dB, and the levels at the receptors change by at most 0.0005 dB.
Two choices follow Volume 3 where Volume 2 leaves room: the heights that cut the initial climb and the final approach are Volume 2’s in feet (its heights in metres are rounded: 304.8 m scaled by them gives 37.72 m where Volume 2’s example says 37.8 m), and an arrival’s landing threshold is its approach’s lowest node above the runway (290.2 m before touchdown for the jets, 328.1 m for the turboprop). The azimuth of the start-of-roll directivity is taken in the plane of the runway, as Volume 3 takes it (straight behind a source 1 m up it is 180 degrees).
What is not checked: the maximum levels (Volume 3 gives none; the tests check them beside, behind and ahead of segments against Volume 2’s equations) and banked turns (the cases fly them level).
Flight profiles against Doc 29 Volume 3
The same script holds acoustic_spaces.doc29.performance, the flight performance of
Volume 2 Appendix B (see Aircraft by ECAC Doc 29),
against the reference profiles of Volume 3 Part 2: JETW flying departure and approach
procedures and PROP departure procedures, nine arrivals and seventeen departures (its
tables C-7 and C-8; Volume 3 gives no arrivals of PROP), and the fixed-point profiles
Volume 3 gives for them (D-1 and D-2, which the package holds, to 0.1 ft, kt and lb).
The cases fly from sea level and from 2000 and 5000 ft, at 15 and 40 °C, at sea-level
pressures of 29.92 and 30.71 inHg, into headwinds of -5, 0 and 8 kt; the departures
climb at constant speed, accelerate at a rate of climb or with a share of the thrust,
cut back to climb thrust or deeply to the minimum reduced thrust, and fly level at
constant speed or accelerating; the arrivals descend at constant speed or decelerating,
fly level at constant speed, decelerating or at idle, and descend at idle.
The profiles. Every case has as many points as Volume 3’s, 314 in all, and every point’s height, true airspeed and corrected net thrust per engine agree to Volume 3’s rounding (within 0.05 ft, kt and lb). The distances along the track agree within 0.15 ft; Volume 3’s own distances for the same step differ by as much between cases (ICAO_A’s acceleration from 3787.5 ft is 4678.3 ft long in case 6, 4678.5 ft in case 74, with the same start).
Volume 3’s profiles differ from Volume 2’s printed equations in three places, and the package follows Volume 3’s:
A propeller aircraft’s thrust at the middle of a climb (eq. B-12 in B6.1.2) takes the true airspeed there of the climb’s calibrated airspeed, as the jets’ thrust takes the middle’s altitude, not the rms of the two ends’ true airspeeds that Volume 2 prints: that puts PROP’s climbs up to 545 ft farther along at 10,000 ft.
The deceleration of a Descend-Decel step (eq. B-41) takes the speeds along the path over the ground, the true airspeeds less w/cos γ, where Volume 2 prints the true airspeeds less w, divided by cos γ: that moves the thrust by up to 9.3 lb.
An arrival flies at 90 % of the greatest landing weight, as Volume 2 B7 says (143,299.8 lb), not at the 143,300 lb of the default weights table (C-5): 0.12 lb.
Volume 3’s approach procedures are taken as its table C-6.2 prints them, to 0.1 ft, kt and degree, which its profiles are computed from: its workbook’s steps have more digits (49.868766 ft where the table prints 49.9), which move the profiles by up to 0.62 ft and 0.86 lb. Its table gives the lengths of the Level-Idle steps in the column of the descent angle; they are the steps’ distances.
What is not checked: the idle steps of an approach away from sea level in the standard atmosphere, which Appendix B7.1.2 and B7.1.4 adjust so that the aircraft slows as it does there (all of Volume 3’s arrivals are at sea level in the standard atmosphere; the tests check that the deceleration holds), a runway’s gradient (all of its runways are level; the tests check eq. B-18), a propeller aircraft’s approach (Volume 3 gives none), the noise of these profiles (Volume 3 gives none) and turns (the calculation flies them straight).
An aircraft in the engine against Doc 29
validation/aircraft_noise.py holds the airport example’s flight demo
(acoustic_spaces.demos.aircraft, see Aircraft taking off and
landing) against Doc 29’s own levels: JETW’s
source (doc29.source), simulated in the engine, against its NPD curves in the
scene’s air, and the example’s flights against Doc 29’s sum over the same flight
path’s segments. Over the meadow and the runway, which scatter nothing, the late rays
bring the microphones no sound.
The source against its NPD curves. JETW flies straight and level at 160 kt, the NPD curves’ speed, over a microphone 1.2 m above grass, at 15,000 lb of thrust an engine departing and 5,000 lb arriving:
distance |
departure: L_ASmax |
SEL |
arrival: L_ASmax |
SEL |
|---|---|---|---|---|
200 ft (61 m) |
99.7 (102.5) |
104.0 (104.0) |
95.7 (98.4) |
99.9 (101.8) |
400 ft (122 m) |
94.2 (95.4) |
100.1 (100.2) |
90.1 (91.2) |
96.0 (98.0) |
630 ft (192 m) |
90.1 (90.6) |
97.4 (97.4) |
86.0 (86.5) |
93.3 (95.2) |
1000 ft (305 m) |
85.6 (85.8) |
94.5 (94.4) |
81.5 (81.6) |
90.3 (92.1) |
2000 ft (610 m) |
78.1 (78.2) |
89.5 (89.3) |
74.1 (74.0) |
85.5 (87.0) |
4000 ft (1219 m) |
69.7 (70.0) |
83.7 (83.6) |
66.0 (65.9) |
79.9 (81.4) |
(dB(A); the NPD curves’ in brackets, with Doc 29’s impedance adjustment.) The engine’s pass is measured as Doc 29 defines its levels (Volume 2’s glossary, section 4.1 and its footnote 15): L_ASmax is the highest of its A-weighted level through a sound level meter’s slow time weighting, and the SEL is taken over the time that level is within 10 dB of it. The source is made to the NPD curves’ L_Amax 1000 ft away, raised by the 0.29 dB the slow time weighting takes off a point source’s loudest moment there, and the engine gives it back within 0.2 dB. Nearer, the NPD curves’ L_Amax grows faster than one point source’s with one spectrum: at 200 ft the engine reads 2.8 dB (departure) and 2.7 dB (arrival) under them. With no time weighting, the highest level of the places is 2.0 dB over L_ASmax at 200 ft, 1.0 dB at 400 ft, 0.6 dB at 630 ft and less farther out (0.3 dB at 1000 ft, under 0.1 dB at 4000 ft), and the SEL of the whole walk is 0.34 to 0.46 dB over the 10 dB-down one. The departure’s SEL is within 0.2 dB of its NPD curves, the arrival’s 1.5 to 2.0 dB under: JETW’s arrival curves have SEL - L_Amax = 10 lg(πd/V) within 0.22 dB out to 1000 ft, the SEL of a point source’s whole pass over its level as it passes, with no time weighting and in air that absorbs nothing. Measured as Doc 29 defines its levels, that source’s SEL - L_ASmax is 1.0 dB more at 200 ft and 0.7 dB less at 1000 ft, and the air takes more off; the departure’s curves are 1.9 to 2.2 dB under 10 lg(πd/V). Volume 3’s aircraft are hypothetical, and its arrival curves seem not to follow those definitions.
The airport’s flights. The demo’s departure and arrival, simulated every 20 m at each listener, their level following their thrust:
listener |
departure: L_ASmax |
SEL |
arrival: L_ASmax |
SEL |
|---|---|---|---|---|
departure_4km |
87.1 (87.2) |
95.9 (96.0) |
50.2 (43.1) |
64.4 (60.7) |
lateral_450m |
85.0 (85.1) |
95.5 (94.5) |
41.8 (54.4) |
56.4 (68.8) |
approach_2000m |
52.0 (54.8) |
67.3 (68.6) |
90.5 (91.5) |
96.8 (98.8) |
(dB(A); Doc 29’s in brackets.) Where the arrival is heard rolling, the walk starts or ends less than 10 dB under its L_ASmax, so its SEL there is over less than the 10 dB-down time. Where the jet is heard in the air, they agree within 1.0 dB but for the arrival’s SEL, 2.0 dB under as its NPD curves have it. Where it is heard rolling on the runway they part, as the two reckon sound running along the ground differently. Doc 29 takes off its lateral attenuation, 10.9 dB at grazing for a listener ahead of a landing roll or behind a take-off roll, from measurements and so averaged over their weather, and behind a take-off roll adds its start-of-roll directivity (5.1 dB down at approach_2000m). The engine reckons the scene’s ground in still air: the hard runway reflects the sound back up, so the arrival’s roll-out is 7.1 dB over Doc 29 at departure_4km, 2.4 km ahead of it along the runway, while the meadow takes much of it away from 250 Hz up, so it is 12.6 dB under at lateral_450m, 1 km away across the grass; the departure’s take-off roll is 2.8 dB under at approach_2000m.
Ground-borne vibration against the FTA’s manual
validation/fta_vibration.py holds acoustic_spaces.vibration (see Vibration through
the ground) against the manual it comes from,
the FTA’s Transit Noise and Vibration Impact Assessment Manual (FTA Report No. 0123,
2018).
The base curves against figure 6-4. The manual gives its curves twice: as equations (table 6-10) and drawn (figure 6-4). The equations, against the figure read by eye to about half a decibel:
curve |
10 ft |
100 ft |
300 ft |
|---|---|---|---|
locomotive-powered trains |
94.6 (94.5) |
78.4 (78.5) |
67.1 (67.0) |
rapid transit or light rail |
81.6 (81.5) |
67.5 (67.5) |
55.8 (56.0) |
rubber-tyred vehicles |
75.5 (75.0) |
56.8 (57.0) |
50.6 (50.5) at 200 ft |
(VdB; the figure in brackets. The bus’s curve leaves the figure’s 50 VdB at about 200
ft.) The figure draws the curves from 10 to 300 ft; fitted as cubics in log10 of the
distance, they turn back up farther out (the bus’s past about 1090 ft). Curve.level
and ground_level refuse distances outside that range (Curve.level takes them with
extend=True); Curve.levels, which the pass-by demos’ rumble and shaking take, holds
the 10 ft value nearer and goes on along the curve’s slope at 300 ft farther, straight
on in log10 of the distance, as extend does.
The worked example. Example 6-1 has light rail at 40 mph 125 ft from wood-frame houses on soil that propagates efficiently, reads the base curve there as 65 VdB, and adds: 65 - 1.9 for the speed = 63.1; + 10 for the soil - 5 for the coupling = 68.1; + 6 for the floor’s resonances - 2 to the first floor = 72.1. From the same reading the code gives 63.1, 68.1 and 72.1; from the curve itself, 65.43 VdB at 125 ft, 72.5.
The speed rows. Table 6-11’s adjustments for 20 to 60 mph against 20 log10 of the speed (eq. 6-4), for rail against 50 mph and buses against 30 mph: all ten within the table’s 0.1 dB.
The plant’s and the damage criteria’s levels. Tables 7-4 and 7-5 give each row’s rms level beside its peak particle velocity, “calculated from the PPV limits using a crest factor of 4”, 12 dB. All 14 rows of plant and the four damage criteria are within the tables’ rounding, 0.5 dB, but for a hydromill in rock: its 0.017 in/s gives 72.6 VdB, and the table prints 75. The code keeps both as printed.
The manual’s words. Its text has light rail “70 VdB or more near their tracks” (73.1 VdB 50 ft out on its curve) and buses and trucks rarely over 70 VdB (69.6 VdB 25 ft out). It also puts heavy diesel locomotives “approximately 5 to 10 dB higher” than rail transit vehicles; its two curves are 12.3, 11.5 and 10.9 dB apart at 25, 50 and 100 ft.
No measurement is compared here: the curves are the upper range of measurements of North American systems, and the method gives no spectra.
Edge diffraction in whole cities
Edge diffraction looks, for the source and for each listener, at every pair of an edge and a plane they face, for a path that reflects off the plane before or after bending over the edge. In a city the edges and the planes both grow with the buildings, so the pairs grow with their square: 900 buildings make 20 million pairs per listener. Most pairs cannot carry a path. The ray tests start just off the edge and head for the mirror image of the source or listener in the plane, so a ray from an edge behind the plane never reaches it, and one from the rest of the edge meets the plane where the image casts the edge’s shadow on it, to within a margin that the ray’s slant sets. Where that shadow misses the box round the plane’s faces, no reflection can happen, and the engine leaves the pair out before tracing a ray. For a listener’s images it also leaves out the paths that would touch the edge’s line beyond its ends or arrive too late. Pairs whose rays graze the plane, or whose image lies too near it for the margin to hold, are all kept. The exact tests then run on what is left, as before, so the results do not change.
validation/city_speed.py builds cities of n by n blocks 32 m apart, each a building
of random size (12 to 20 m a side) and height (6 to 30 m), with grass in the streets.
A source stands in a street crossing in the middle, 1 m up, and two listeners stand 3
and 5 blocks off. The simulation is the outdoor default: early reflections to the third
order, the direct sound and first-order reflections bending over the edges, and 50,000
rays per band for the late part. Times are from one run (--sizes 10 20 30 40 60) on 4
cores of a cloud machine with nothing else running:
Buildings |
Faces |
Edges |
Build (s) |
Simulation (s) |
Of it diffraction (s) |
Pairs tested |
Peak memory |
|---|---|---|---|---|---|---|---|
100 |
1,012 |
800 |
0.1 |
3.1 |
2.1 |
8.5 % |
0.3 GB |
400 |
4,012 |
3,200 |
0.4 |
7.0 |
6.4 |
4.3 % |
0.3 GB |
900 |
9,012 |
7,200 |
1.0 |
12.9 |
12.1 |
2.9 % |
0.4 GB |
1,600 |
16,012 |
12,800 |
2.1 |
17.9 |
16.9 |
2.7 % |
0.5 GB |
3,600 |
36,012 |
28,800 |
5.3 |
48.1 |
46.7 |
3.3 % |
1.8 GB |
Diffraction includes finding the model’s edges and where they end, and the terms that
make the other specular paths fade at the edges
(above): those terms took
three quarters of the simulation of 900 buildings and half of that of 3,600, and
finding the edges about a fifth of the latter. In a one-off
check when the culling was written, on a run where 900 buildings simulated in 16.6 s
(15.6 s of it diffraction), 1,600 in 21.4 s (20.1 s) and 3,600 in 56.4 s (54.5 s),
they did so without those terms in 2.6 s (1.6 s), 4.8 s (3.6 s) and 24.4 s (22.4 s).
The tested share stays near 3 %: the shadow of a wall facing the source covers a wedge of the city
that widens away from it, and only the ray tests tell whether other buildings hide the
wall. The work therefore still grows with the square of the buildings, and a few
thousand buildings take tens of seconds per source. Tens of thousands need the map cut
down to the area round the sources and listeners, or diffraction: direct, whose cost
grows with the edges alone.
Exactness. The script’s check runs a city of 4 by 4 blocks with the buildings turned at random angles and paths that reflect on both sides of an edge. It runs two sources, one in a street and one over the roofs, to two listeners, once as the engine runs, on one thread and on every core, and once with every pair tested. Every path, its energy and its spectrum come out the same bit for bit; the early paths took 0.9 s instead of 3.0 s. When the culling was written, the same comparison over every example and three test cities, with paths reflecting on one side and on both sides of an edge and over two edges, found no difference either (a one-off check; the script repeats the 4 by 4 city). The tests check the culling against rays traced from random edges to a tilted rectangle of faces, at grazing angles, for faces that stray from their plane and for planes with only openings.
Wave-based solver
validation/wave_solver.py checks the wave solver against theory: closed forms where
there are any, and for a whole room the sum of its modes. It has two stencils, each at
its stability limit: the standard one (7 points, the six axial neighbours) and the
interpolated isotropic one (19 points, the twelve edge neighbours too), which closed
rooms take. Each check runs with both where both apply. (Each takes its Laplacian
times 1 − 2⁻¹⁸, which slows sound by 2⁻¹⁹: at the limit itself the highest modes, the
7-point stencil’s checkerboard and the 19-point one’s modes alternating along two
axes, sit on the edge of stability, where a kick grows linearly and single precision’s
rounding can take them over it.)
Speed of sound on the grid. Waves on the grid travel a little slower the shorter they are. From the peaks of a rigid 2.4 x 2.4 x 0.2 m box (10 cm cells) ringing for 8 s, against the exact frequencies of its modes and against each stencil’s dispersion relation, 2 − 2 cos ωT = Σ g_k (1 − cos k·d_k) over its links:
direction |
mode |
cells per wavelength |
7-point, relation |
wave solver |
19-point, relation |
wave solver |
|---|---|---|---|---|---|---|
along an axis |
(6, 0, 0) |
8.00 |
−1.740 % |
−1.740 % |
−0.672 % |
−0.672 % |
along a diagonal |
(4, 4, 0) |
8.49 |
−0.387 % |
−0.388 % |
−0.573 % |
−0.573 % |
Both follow their relations within 2e-5. At 8 cells per wavelength the 7-point stencil is 1.74 % slow along the axes, 0.44 % along the face diagonals and exact along the body diagonals; the 19-point one is 0.65 to 0.67 % slow in every direction. It needs 5.2 cells per wavelength to be as close as the 7-point one is at 8.
Modes and their decay. A 7 x 5 x 3 m box rings for 8 s (10 cm cells). Its walls’ admittance changes with frequency as a material’s does on the wave solver’s grid: a constant 0.002 and a branch resonating at 60 Hz (Q 1.5, admittance 0.008 at resonance), so below 60 Hz they give like a spring and above it weigh like a mass. For each mode that stands apart from the others, the frequency of its peak and the decay rate of its envelope match first-order perturbation theory: the decay rate δ = c Re(β)/2 Σ (4/L along each axis the mode varies, 2/L along the others), β the walls’ admittance at the mode, and the rigid box’s frequency moved by −c Im(β)/(4π) times the same sum. With either stencil the frequencies come out within 0.25 % of theory (the walls move them by up to 0.5 %), the decay rates, which differ more than fourfold, within 1.8 %:
mode |
rigid box (Hz) |
theory (Hz) |
7-point (Hz) |
19-point (Hz) |
Re(β) |
decay, theory (1/s) |
7-point (1/s) |
19-point (1/s) |
|---|---|---|---|---|---|---|---|---|
(1, 0, 0) |
24.50 |
24.39 |
24.39 |
24.39 |
0.0028 |
0.779 |
0.770 |
0.770 |
(0, 1, 0) |
34.30 |
34.14 |
34.14 |
34.15 |
0.0039 |
1.185 |
1.167 |
1.168 |
(1, 1, 0) |
42.15 |
41.93 |
41.91 |
41.91 |
0.0057 |
1.990 |
1.955 |
1.958 |
(2, 0, 0) |
49.00 |
48.84 |
48.87 |
48.88 |
0.0078 |
2.200 |
2.191 |
2.195 |
(0, 0, 1) |
57.17 |
57.10 |
56.97 |
56.98 |
0.0098 |
3.407 |
3.442 |
3.445 |
(0, 2, 1) |
89.30 |
89.56 |
89.55 |
89.54 |
0.0052 |
2.152 |
2.124 |
2.117 |
Each decay rate is the slope of the mode’s envelope from 1 s on, over 50 dB at most: the fastest modes reach the noise floor of single precision before the run ends. The theory’s rates move by up to 0.35 % on the 19-point grid, whose time step is longer.
Axial modes lose energy at walls they meet head-on and at walls they graze, so this checks absorption at all angles.
Walls. A plane wave down a duct (10 cm cells) reflects off its end as (1 − β)/(1 + β) predicts at normal incidence within 0.004 for β up to 0.5, but returns 0.044 where it predicts nothing (β = 1); grazing its absorbing walls it decays as exp(−βP/(2A)) per metre (perimeter P, cross-section A), whatever the cell size:
end admittance β |
0 |
0.1 |
0.25 |
0.5 |
1 |
|---|---|---|---|---|---|
reflection, theory |
1.000 |
0.818 |
0.600 |
0.333 |
0 |
7-point stencil (60 to 150 Hz) |
0.998 |
0.817 |
0.601 |
0.336 |
0.044 |
19-point stencil |
0.999 |
0.818 |
0.602 |
0.337 |
0.044 |
walls β = 0.05, 0.6 x 0.6 m duct, amplitude after 10 m |
theory |
10 cm cells |
5 cm cells |
|---|---|---|---|
7-point stencil |
0.1889 |
0.1900 |
0.1906 |
19-point stencil |
0.1889 |
0.1905 |
0.1907 |
Walls that absorb as their materials do. The wave solver gives each material an admittance that changes with frequency: a constant and resonant mass-spring-damper branches, one at each wave band’s centre and one beyond each end, fitted so that the random-incidence absorption, counted through the analysis’s band filters, matches the material’s in every band. At the grid of the 500 Hz band:
material, 63 to 500 Hz |
absorption |
fitted |
branches |
|---|---|---|---|
porous absorber |
0.05, 0.15, 0.40, 0.70 |
0.050, 0.150, 0.400, 0.700 |
6 |
panel absorber |
0.35, 0.30, 0.15, 0.08 |
0.350, 0.300, 0.150, 0.080 |
5 |
audience |
0.50, 0.60, 0.75, 0.85 |
0.500, 0.600, 0.750, 0.850 |
6 |
plaster on concrete |
0.01, 0.01, 0.015, 0.02 |
0.010, 0.010, 0.015, 0.020 |
6 |
a steep resonance |
0.10, 0.60, 0.25, 0.10 |
0.136, 0.579, 0.253, 0.100 |
4 |
The octave filters overlap, so a band next to a much more absorbing one cannot absorb
much less than it lets through: the steep resonance is met within 0.04. Simulations
report the largest miss as wave_absorption_miss. With the porous absorber’s fitted
admittance at the end of a duct (5 cm cells, 0.2 m across), against a rigid end’s
reflection, which the grid returns whole at every frequency:
frequency (Hz) |
31.5 |
44 |
63 |
88 |
125 |
177 |
250 |
354 |
500 |
707 |
|---|---|---|---|---|---|---|---|---|---|---|
7-point: normal-incidence absorption, fitted admittance |
0.030 |
0.022 |
0.022 |
0.037 |
0.075 |
0.138 |
0.259 |
0.366 |
0.567 |
0.597 |
7-point: the grid’s theory |
0.030 |
0.022 |
0.022 |
0.037 |
0.074 |
0.137 |
0.253 |
0.355 |
0.542 |
0.571 |
7-point: wave solver |
0.030 |
0.022 |
0.022 |
0.037 |
0.074 |
0.137 |
0.253 |
0.355 |
0.542 |
0.571 |
19-point: normal-incidence absorption, fitted admittance |
0.030 |
0.022 |
0.022 |
0.037 |
0.072 |
0.143 |
0.268 |
0.346 |
0.532 |
0.659 |
19-point: the grid’s theory |
0.030 |
0.022 |
0.022 |
0.036 |
0.072 |
0.142 |
0.262 |
0.338 |
0.509 |
0.651 |
19-point: wave solver |
0.030 |
0.022 |
0.022 |
0.036 |
0.072 |
0.142 |
0.262 |
0.338 |
0.509 |
0.651 |
(Each stencil has its own time step, so its own fit.) The wave solver matches the grid’s theory (a plane wave on the grid, the wall half a cell past the last cell centres) within 0.0002 with either stencil, from 30 to 720 Hz, and the rigid end, which the grid returns whole, measures within 0.0002 of 1. (The source also excites the 20 cm duct’s first symmetric cross mode, which rings on just above its cut-on, 1.59 kHz on the 7-point grid, for as long as a run lasts, and an abrupt cut spreads it over every frequency. So the runs’ end fades over 20 ms, which brings the absorption that close, and so does the window that cuts out the incident wave, which brings the rigid end that close.) The half cell between the last cell centres and the wall takes a little of the absorption away as the wavelength shortens: within 0.013 (7-point) and 0.009 (19-point) of the fitted admittance’s below 360 Hz, 0.025 and 0.023 less at 500 Hz with 14 cells per wavelength. The fit does not correct for it.
Open models. Round a model whose air reaches the edge of the grid, the grid grows by a perfectly matched layer (split-field, its damping growing as the square of the depth). A rigid 8 x 6 m plate in the open, the source 1.5 m above it, three listeners round it, 25 to 250 Hz (20 cm cells, the 7-point stencil, the only one with the matched layer), against a grid 16 m larger all round, from whose edge nothing comes back in the 90 ms of the runs: what differs, relative to the sound itself (the runs’ last 10 ms fade out: between 500 Hz and 1 kHz, where a wavelength has fewer than four of these cells, the 8-cell layer returns sound only 15 to 30 dB below the sound there, in a one-off check, and an abrupt end spreads some of it over the bands compared),
boundary of the grid |
listener 1 (dB) |
listener 2 |
listener 3 |
air cells |
|---|---|---|---|---|
the grid’s edge alone (admittance 1, as in 2.0.0) |
−6.6 |
−13.5 |
−11.0 |
28,380 |
matched layer, 6 cells |
−61.7 |
−64.9 |
−60.0 |
79,200 |
matched layer, 8 cells (the default) |
−72.2 |
−74.1 |
−74.4 |
104,076 |
matched layer, 12 cells |
−80.7 |
−81.7 |
−82.2 |
168,036 |
The edge alone absorbs only sound that meets it head-on; what a layer returns falls with its depth at every listener. Runs take 8 cells, which is not a setting. In the layer the sound keeps falling over 59,409 steps (20 s): 78 dB below the first second’s level after one second, at least 134 dB below it through the second half.
Sound that runs along the layer meets it near grazing, where it sends much more back. In one-off checks over a rigid plate (open below), against the exact solution over a rigid plane, a layer only a few cells above the source and the listener, both 1.5 m above the plate, puts the level 0.26 dB low at 125 Hz 20 m away, 0.50 and 1.71 dB low at 63 and 125 Hz 40 m away (20 cm cells), and at 63 Hz 2.84 dB low 80 m away and 9.63 dB low 160 m away (40 cm cells); with 5 cm cells, the two 0.1 m up and 7 m apart, 0.63 dB high at 125 Hz. So the grid reaches past the source and the listeners, on each side the model leaves open to them, by 15 % of the farthest a listener lies from the source along that side (none under an outdoor ground, and in whole cells, so that the grid keeps its place on the model). With that room the same runs are within 0.03 dB of the exact solution 20 to 160 m away, where three times the room moves them by 0.02 dB at most (to 80 m away; 160 m away that grid has more cells than a run takes), and within 0.04 dB with the 5 cm cells. One case stays 0.07 and 0.15 dB off at 63 and 125 Hz: the source and the listener 0.1 m up and 20 m apart with 10 cm cells, whose layer is 0.8 m deep; 25 % of room brings it within 0.01 dB. (In two more one-off checks, with the trilinear reading: beside the plate’s edge the room brought the level at 125 Hz within 0.01 dB of a wider grid’s, and over the rigid 3 m block of the edge diffraction checks, at 6.2 cm cells, to −9.00 and −11.21 dB against BTM’s −9.04 and −11.25. Set up again, that block reads −9.07 and −11.35 dB trilinearly and −9.06 and −11.31 dB with the cubic reading.) It costs cells on each open side where the model reaches less far than that room: in these checks 1.5 and 2.0 times as many 20 and 40 m away at 20 cm cells and 2.2 and 3.5 times 80 and 160 m away at 40 cm cells. A side that the model’s own surfaces close round the source and the listeners gets none: the air round them, flooded over the grid’s cells within that room, reaches no layer there (so the plate’s grids grow above it and to its sides, not below it). In a dry layout of a hall 40 x 20 x 4 m open at one end, its listeners 8 to 33 m from the source, the grid stays on the hall, where room on every side would take 1.8 and 2.0 times the cells at 125 and 250 Hz, under its floor and over its roof; its levels are within 0.001 dB of those on a grid with three times the room. Outdoors, where nothing is added under the ground, only where the sky (by default 30 m above the highest building) or the ground’s edge lies nearer than that room: 13 % more on the 63 Hz grids of the wave solver in wind and temperature (a sky 30 m up, listeners up to 200 m away), with or without moving air, and none on its 125 Hz grids, on the free field and façade grids of moving air or on the ground reflection’s wave check.
One run for all bands. A 7 x 5 x 3 m box whose absorption differs in every band (0.10 to 0.25 from 63 to 500 Hz), the wave solver up to the 500 Hz band: one run of 868,701 cells and 5,617 steps of the 19-point stencil (the 0.5 s response and 0.2 s past its end), 5.0 s on 4 cores with the fit and the grid’s set-up, where 2.0.0 ran one per band. Timed on its own over as many steps, the same grid runs in 4.2 s with the walls’ six branches and in 3.3 s with constant walls: the branches cost about a quarter more than a run with constant walls, and save three runs.
The end of a response. The bands’ filters spread each arrival both ways in time, so they read a response’s last slots from the run after them too, and a simulation steps the solver 0.2 s further than its responses last (0.4 s with third-octave bands). In a 5 x 4 x 3 m box with 2 % absorption, the wave bands’ energy per 10 ms of a 1 s response against the same slots of a 2 s response, the largest difference over two listeners and the bands up to 125 Hz:
bands |
the run |
last five slots (dB) |
earlier slots (dB) |
|---|---|---|---|
octave |
stops at the response’s end |
7.54 |
0.19 |
octave |
goes on for 0.2 s |
0.0001 |
0.0000 |
third-octave |
stops at the response’s end |
15.72 |
1.67 |
third-octave |
goes on for 0.4 s |
0.0016 |
0.0009 |
The run that goes on also keeps a slow drift out of the bands. In single precision the 19-point stencil’s rounding lets a closed room’s mean pressure creep. That is far below the bands, and only the end of a run brings it into them. In a one-off check of a rigid room against the same scheme in double precision, the mean was as large as the sound after 100 s: the bands’ last five slots were then 5.9 dB off with a run that stopped at the response’s end, and every slot within 0.012 dB with the run going on.
Free field. In a 30 x 24 x 24 m room with 95 % absorption, the direct sound’s energy in the 63 and 125 Hz bands along x from the source, in dB over the free-field level the rays give:
distance |
19-point, 63 Hz |
19-point, 125 Hz |
7-point, 63 Hz |
7-point, 125 Hz |
|---|---|---|---|---|
1 m |
−0.03 |
+0.01 |
+0.06 |
+0.08 |
2 m |
−0.02 |
−0.00 |
+0.00 |
+0.01 |
4 m |
−0.01 |
−0.01 |
−0.00 |
−0.01 |
8 m |
−0.04 |
−0.02 |
−0.04 |
−0.02 |
That is for one place of the source within its cell and one direction. The source and each point a listener samples lie between the cells’ centres and take four cells a side, weighted as a cubic through their centres (see Simulation). Over 18 places of the source within a cell, with listeners in 50 directions, the grid’s 26 axes and diagonals and 24 others (in a rigid cube large enough for nothing to come back within the direct sound’s first 50 ms), against the exact field of a point source with the same pulse: the pressure’s energy, and the energy of the pressure’s gradient (the first-order field’s X, Y and Z) over the pressure’s, each in dB over the exact one, from the least to the most; and how far the gradient’s main axis lies off the line to the source at most, in the worse of the two bands:
cells from the source |
19-point: pressure, 63 Hz |
125 Hz |
gradient over pressure, 63 Hz |
125 Hz |
off the line |
7-point: pressure, 63 Hz |
125 Hz |
gradient over pressure, 63 Hz |
125 Hz |
off the line |
|---|---|---|---|---|---|---|---|---|---|---|
1 |
−1.76 to +2.86 |
−1.79 to +2.64 |
−7.30 to −0.01 |
−6.49 to +0.16 |
11.4° |
−1.62 to +2.38 |
−1.49 to +2.35 |
−5.87 to +3.86 |
−5.53 to +3.57 |
14.9° |
1.5 |
−1.36 to +1.53 |
−1.19 to +1.17 |
−6.29 to +0.69 |
−5.12 to +0.88 |
15.6° |
−0.88 to +1.68 |
−0.70 to +1.60 |
−0.96 to +6.18 |
−0.88 to +5.53 |
21.2° |
2 |
−0.59 to +0.61 |
−0.57 to +0.37 |
−4.48 to +0.61 |
−3.64 to +0.45 |
13.4° |
−0.31 to +0.67 |
−0.21 to +0.64 |
−1.49 to +5.41 |
−1.20 to +4.58 |
14.6° |
2.5 |
−0.44 to +0.42 |
−0.38 to +0.10 |
−0.80 to +3.66 |
−0.66 to +2.64 |
9.8° |
−0.20 to +0.83 |
−0.11 to +0.58 |
−3.41 to +2.23 |
−2.10 to +1.78 |
5.3° |
3 |
−0.13 to +0.31 |
−0.03 to +0.05 |
−0.75 to +1.20 |
−0.71 to +0.59 |
7.2° |
−0.07 to +0.32 |
+0.18 to +0.26 |
−1.68 to +0.74 |
−0.99 to +0.42 |
4.4° |
4 |
−0.04 to +0.04 |
−0.04 to +0.02 |
−0.43 to +0.27 |
−0.15 to +0.18 |
2.3° |
−0.02 to +0.16 |
+0.12 to +0.25 |
−0.33 to +0.24 |
−0.10 to +0.24 |
1.5° |
8 |
−0.00 to +0.00 |
−0.02 to +0.01 |
−0.01 to +0.01 |
+0.01 to +0.02 |
0.1° |
+0.03 to +0.04 |
+0.02 to +0.32 |
−0.04 to +0.05 |
−0.03 to +0.09 |
0.4° |
12 |
−0.00 to +0.00 |
−0.02 to +0.00 |
+0.00 to +0.00 |
+0.01 to +0.02 |
0.1° |
+0.01 to +0.05 |
−0.01 to +0.34 |
−0.02 to +0.03 |
−0.02 to +0.06 |
0.4° |
From four cells on the 19-point stencil’s level is within 0.04 dB wherever the source and the listener lie within their cells and in every direction. A grid has a gain of its own on a point source’s sound, more the higher the frequency. The 19-point stencil’s is the same in every direction within 0.01 dB over a band, 9 / (5 + 4 cos ωT) in pressure (0.06 and 0.35 dB over these two bands), and three taps in the source’s signal undo it. The 7-point stencil’s changes with the direction, so no signal can: twelve cells away in the 125 Hz band it reads −0.01 to +0.01 dB along an axis, +0.25 dB along a face’s diagonal and +0.32 to +0.34 dB along the cube’s (the 19-point one −0.02 to +0.00 dB in all three).
Within three cells of the source its sound on the grid is not a point’s. There a listener’s points take the eight cells round them, weighted trilinearly, which read the 19-point grid’s pressure and the 7-point grid’s gradient closer than the cubic does (not the 7-point grid’s pressure: 2.5 cells away it is up to 0.83 dB off, against 0.35 dB with the cubic). Where the reading changes, three cells from the source, the level steps by up to 0.37 dB in the octave up to 8 cells per wavelength and 0.15 dB in the one below (40 directions, in a one-off check). A listener’s gradient comes from points up to two cells from it and settles a cell further out. On the 19-point grid it goes without a point that lies nearer the source than 1.5 cells and nearer it than the listener: with those points its main axis is up to 26 and 21 degrees off the line 1.5 and 2 cells away and its energy up to 13.2 dB off 2.5 cells away (16 and 13 degrees and 3.7 dB without them). A listener nearer the source than 1.5 cells so keeps the points on its far side, and from 0.9 cells out the gradient’s energy changes by 2.4 dB at most from one listener to the next 0.1 cells further out (a one-off scan every 0.1 cells from 0.5 to 2). On the 7-point grid leaving the points out gains nothing clear, and it keeps them. At some distances the gradient’s energy over the pressure’s is further off than with the source and every point read trilinearly and no point left out: 3.0 to 3.9 and 4.1 to 4.8 cells away on the 19-point grid (1.6 dB against 0.6 dB at 3.5 cells, 0.41 against 0.29 at 4.4), and 1.2 to 3.9 cells away on the 7-point one (5.4 dB against 3.8 dB at 2 cells, 3.3 against 1.6 at 2.6, 0.62 against 0.45 at 3.8); elsewhere it is closer. Its main axis lies up to 4.9 degrees further off the line (12.3 against 7.4 degrees, 2.3 cells away on the 19-point grid). From 2 to 3.4 cells away that comes mostly from the source: spread over four cells a side, its sound is not a point’s within about two cells of it, where some of a listener’s gradient points lie (two cells away on the 7-point grid, 4.0 dB off with the source over its eight cells and everything else the same), and on the 19-point grid an axis that goes without a point near the source is a second-order difference. From 3.4 to 3.8 cells away on the 7-point grid, and 3.8 and 4.4 to 4.8 cells away on the 19-point one, it comes from the listener’s reading, and part of it from the measure: read trilinearly, the pressure loses about as much as the gradient, which cancels in their ratio (up to 0.16 dB), while the pressure read as here is the closer of the two (3.6 cells away on the 7-point grid, 0.24 dB off against 0.36 dB). (One-off scans every 0.1 cells from 1 to 6, over 18 places of the source and 50 directions, the worse of the two bands.)
Next to a surface along the grid (a floor, a wall, flat ground) a point leaves out the cells behind it: across the surface it reads the two cells round it, weighted linearly (within half a cell of the surface the one layer on its side), and along the surface still the cubic. A source and a listener 0.3 to 2.5 cells above a rigid plate and 20 m apart, with 20 cm cells, read the 125 Hz band within 0.02 dB of the exact solution wherever they lie within their cells (0.26 to 0.47 dB low read trilinearly, in one-off checks). Sound that arrives across such a surface is read linearly along its way: within 1.5 cells of a wall along the grid, the source 8.3 cells from the wall and 7 to 11.6 cells from the listeners, the level in the octave up to 8 cells per wavelength is 0.14 to 0.39 dB low on the 19-point grid, and between 0.42 dB low and 0.25 dB high on the 7-point one.
Next to a surface at an angle to the grid, an edge or an opening, where the cells round a point are not all its own, it reads the cells it sees, weighted trilinearly (up to 0.7 dB low at 8 cells per wavelength, halfway between two centres along an axis). Along such a wall, listeners 0.05 cells apart differ from one to the next, in the octave up to 8 cells per wavelength, by up to 0.51 dB 0.3 cells from it (0.24 dB at 45 degrees) and 1.2 dB 0.1 cells from it, as they do read trilinearly everywhere. Where the reading changes to the cubic, 1.5 to 2 cells from the wall, the level steps by up to 0.41 dB (0.12 dB read trilinearly everywhere, which reads low instead; walls at 3 to 45 degrees), and 1 to 2 cells above the top of a screen along the grid by up to 0.37 dB (0.09 dB; all in one-off checks).
A whole room. A 7 x 5 x 3 m box with 15 % absorption on every surface, simulated with the wave solver switched on at its default settings (the 63 and 125 Hz bands, 20 cm cells, the 19-point stencil), against the sum of the box’s modes up to 1.5 kHz, each with its decay rate, all analysed alike (ISO 3382-1, octave filters):
model |
G 63 Hz (dB) |
G 125 Hz |
EDT 63 Hz (s) |
EDT 125 Hz |
T20 63 Hz (s) |
T20 125 Hz |
|---|---|---|---|---|---|---|
sum of the modes |
20.3 |
23.5 |
1.02 |
0.96 |
0.94 |
0.90 |
wave solver |
21.1 |
22.8 |
1.04 |
0.95 |
0.94 |
0.87 |
wave solver, 7-point stencil |
21.1 |
23.1 |
1.04 |
0.94 |
0.94 |
0.87 |
wave solver, 16 cells per wavelength |
20.8 |
23.7 |
1.01 |
0.84 |
0.90 |
0.90 |
rays only |
25.5 |
21.5 |
0.69 |
0.77 |
0.92 |
0.78 |
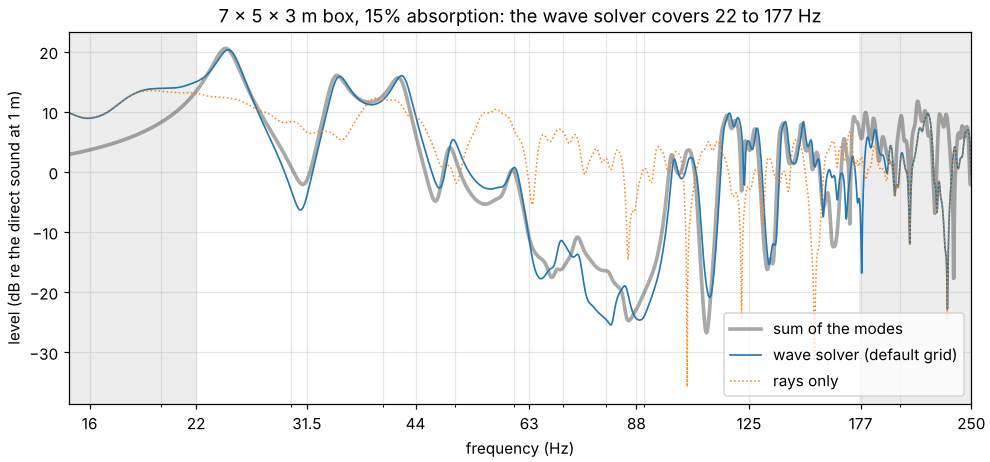
The wave solver follows the modes peak for peak from 22 Hz up. What is left comes mostly from where the grid puts the walls: within half a cell of the model’s, here 6.93 x 4.95 x 2.97 m with 20 cm cells, which moves each mode by up to 1 %. In a room this sparse in modes, that moves G by up to 1 dB, EDT by up to 12 % and T20 by up to 5 %; more cells per wavelength move the walls but do not make every figure converge. The two stencils’ times agree within 0.02 s: in this band their dispersion moves the modes less than the walls’ placement does. The 7-point one’s G is 0.3 dB higher at 125 Hz, where its own gain on the source’s sound is not undone (see Free field): without its taps the 19-point one’s is within 0.01 dB of it. Rays give the average over the room instead: 5.2 dB more at this seat in the 63 Hz band, where the listener sits near the nodes of most modes.
Where the grid puts the walls. validation/wave_walls.py measures what walls on
cell faces cost (the leftover under A whole room, above), with both stencils on the
grids the solver takes when its highest band is the 63, 125 or 250 Hz one, at 8 points
per wavelength (a run up to 125 Hz, the default, takes the 19.8 cm grid for every band).
A rigid 4.13 x 3.37 x 2.71 m box, whose sides are no whole number of cells, is placed as
the solver places a room whose source and listeners lie more than two cells from its
walls, moved from there by parts of a cell along the axes (0, 0, 0; 0.25, 0.5, 0.75;
0.5, 0.25, 0.4), turned by 3, 8 and 14 degrees about the vertical, and turned by 8 and
tilted by 5 degrees. Its modes are the eigenvalues of the grid’s own update, each
analytic mode taken at the eigenvector its shape correlates with best. With every side
rounded to whole cells and the walls on cell faces, the grid’s modes follow the
stencil’s dispersion relation within 2e-6 (the 2⁻¹⁹ by which the solver slows sound,
above): what is off there is the dispersion alone. In each grid’s own band (sharp edges
at the synthesis’s crossovers, 89.1, 176.8 and 353.6 Hz), the worst mode (and the
largest root-mean-square) over the placements:
stencil |
grid |
sides in whole cells, walls on cell faces |
moved within a cell |
turned or tilted |
|---|---|---|---|---|
19-point |
63 Hz band’s (40.5 cm) |
−0.4 % (0.3 %) |
+11.3 % (7.0 %) |
−6.7 % (4.4 %) |
19-point |
125 Hz band’s (19.8 cm) |
−0.4 % (0.3 %) |
+4.9 % (2.0 %) |
−6.4 % (3.2 %) |
19-point |
250 Hz band’s (9.9 cm) |
−0.4 % (0.3 %) |
−2.6 % (1.2 %) |
−2.8 % (1.3 %) |
7-point |
63 Hz band’s (39.6 cm) |
−1.1 % (0.6 %) |
−6.1 % (4.0 %) |
−10.3 % (5.7 %) |
7-point |
125 Hz band’s (19.8 cm) |
−1.0 % (0.5 %) |
+4.5 % (2.0 %) |
−7.0 % (3.6 %) |
7-point |
250 Hz band’s (9.9 cm) |
−1.0 % (0.4 %) |
−3.2 % (1.2 %) |
−3.7 % (1.6 %) |
A box turned against the grid couples modes that lie close together, and a mode’s shape then spreads over several eigenvectors: on their own grids, 1 to 11 of the 31 modes in the 125 Hz band and 22 to 120 of the 195 in the 250 Hz band correlate less than 0.8 with the one they match best (19-point; 0 to 11 and 4 to 117 with the 7-point one; none on the 63 Hz band’s grids or in a box moved within a cell). Of the modes that keep their shape, the worst turned or tilted on those two grids is −4.5 % and −2.5 % off (19-point; −6.8 % and −3.7 % 7-point); the furthest eigenvector that holds a quarter of a mode’s shape (a squared correlation of 0.25), −6.4 % and −3.6 % (−7.4 % and −4.2 %). These are samples, not bounds: which placement is worst depends on how each side rounds to whole cells (on the 9.9 cm grid the first two placements round every side alike), and cells 0.06 % smaller (at 343.0 m/s instead of 343.2) move the worst modes by up to 0.25 percentage points; which modes keep their shape hangs on the 0.8: in the tilted box on the 7-point 125 Hz band’s grid, those smaller cells take the worst of them from −6.8 % to −4.6 % (one-off checks).
The band levels at five listeners 0.74 to 1.19 m from the nearest wall, the source 0.41 to 0.53 m from three (on the 63 Hz band’s grids that is within two cells, where the solver would start its grid less than a cell further out: the placements are samples either way), against the box’s image sources with the solver’s own pulse (more images and a longer FFT move them by less than 0.001 dB), in the same sharp-edged bands (the 63 Hz one from 44.5 Hz), are off by up to 2.7 / 2.8 dB (first 100 / 300 ms) in the 63 Hz band on its grid, 2.5 / 4.3 dB in the 125 Hz band and 4.4 / 2.8 dB in the 250 Hz band with the 19-point stencil (3.3 / 2.9, 2.4 / 4.6 and 4.0 / 3.7 dB with the 7-point one), the most over the listeners and the seven placements; with the walls on cell faces, 0.56 / 0.30, 0.24 / 0.12 and 0.15 / 0.15 dB (19-point). On the 19-point grid an octave finer than a band’s own, the 63 Hz band is off by up to 1.2 / 1.9 dB and the 125 Hz band by up to 1.4 / 0.8 dB.
A single rigid wall, against the same grid’s free field driven by the source and by its image in the model’s wall (so that the grid’s dispersion and the source are the same on both sides): the root-mean-square error over the cell centres 1.5 to 6.5 cells in front of it, by octave of cells per wavelength, with the 19-point stencil (the 7-point one within 0.08 dB of it), and the place of the wall that fits the error best in the first octave, along its normal in steps of 0.01 cell (negative: behind the model’s wall, away from the air). The walls along the grid lie that share of a cell into the air from a cell face:
wall |
8–16 cells per wavelength |
16–32 |
32–64 |
place fitted (cells) |
|---|---|---|---|---|
along the grid, 0.1 cell off a cell face |
0.35 dB |
0.21 dB |
0.10 dB |
−0.10 |
along the grid, 0.25 cell off |
0.91 dB |
0.53 dB |
0.24 dB |
−0.25 |
along the grid, 0.4 cell off |
1.50 dB |
0.85 dB |
0.38 dB |
−0.40 |
at 3 degrees to the grid |
1.17 dB |
0.39 dB |
0.22 dB |
−0.04 |
at 8 degrees |
0.93 dB |
0.07 dB |
0.03 dB |
−0.04 |
at 14 degrees |
0.68 dB |
0.20 dB |
0.05 dB |
−0.06 |
at 25 degrees |
0.54 dB |
0.15 dB |
0.07 dB |
−0.04 |
Along the grid the place is the whole error: against the source’s image in the cell face the grid puts the wall on, what is left is below 0.001 dB, as it is with the model’s wall on a cell face. At an angle, the wall’s place that fits the error best lies within 0.08 cells of the model’s wall with either stencil, and the error is in the steps.
Fitted walls. The same script runs its parts with fitted walls
(simulation.wave.walls: fitted) on the 7-point stencil, the only one they take, beside
walls on cell faces, and four parts of their own; each figure the
simulation page states for them is one
of its checks, to the precision it is stated in (--walls picks the kinds of walls).
In the boxes with every side a whole number of cells the grid’s modes follow the
stencil’s relation within 2e-6, as with walls on cell faces (the update, D⁻¹K with K
symmetric and D the cells’ volumes, is symmetric within 3e-8). In each grid’s own band,
at every placement moved or turned, fitted walls’ modes are off by the stencil’s
dispersion alone, as with every side in whole cells: −1.1, −1.0 and −1.0 % at most on
the 63, 125 and 250 Hz bands’ grids; 2 of the 195 modes of the 250 Hz band mix at most,
none on the other grids. The box’s 16 lowest modes against the exact ones with the
dispersion taken out (least … most, %; on the 125 Hz band’s grid also the worst over
24 more placements, the grid’s origin drawn within a cell):
grid |
turned (degrees) |
walls on cell faces |
fitted walls |
fitted, 24 more placements |
|---|---|---|---|---|
125 Hz band’s (19.8 cm) |
0 / 0 |
−2.31 … +0.04 |
−0.03 … −0.00 |
0.05 |
3 / 0 |
−2.54 … +0.08 |
−0.03 … +0.01 |
0.05 |
|
8 / 0 |
−4.19 … −0.95 |
−0.03 … +0.10 |
0.12 |
|
14 / 0 |
−2.92 … −0.62 |
−0.03 … +0.37 |
0.37 |
|
22.5 / 11 |
−5.72 … −1.19 |
+0.12 … +0.95 |
1.00 |
|
30 / 20 |
−6.03 … −1.59 |
+0.43 … +1.77 |
1.83 |
|
45 / 0 |
−7.12 … −0.61 |
−0.03 … +3.48 |
4.30 |
|
40 / 35 |
−6.19 … −2.17 |
+1.12 … +3.26 |
3.56 |
|
250 Hz band’s (9.9 cm) |
0 / 0 |
−0.75 … +1.30 |
−0.00 … −0.00 |
|
3 / 0 |
−0.91 … +1.30 |
−0.00 … +0.01 |
||
8 / 0 |
−0.95 … +1.30 |
−0.00 … +0.05 |
||
14 / 0 |
−1.42 … +1.30 |
−0.00 … +0.18 |
||
22.5 / 11 |
−2.03 … −0.52 |
+0.06 … +0.49 |
||
30 / 20 |
−2.61 … −0.81 |
+0.20 … +0.92 |
||
45 / 0 |
−3.46 … +1.30 |
−0.00 … +1.26 |
||
40 / 35 |
−3.36 … −1.26 |
+0.58 … +1.77 |
Moved along the grid (the three placements above), fitted walls’ 16 lowest modes are within 0.03 % on the 125 Hz band’s grid and 0.004 % on the 250 Hz band’s, walls on cell faces up to 5.2 % and 2.3 % off. Every mode keeps its shape with fitted walls (correlation 0.987 or more; on cell faces down to 0.71). Turned further than 14 degrees the modes come out high, more the steeper. At 45 degrees the worst over the placements falls in two groups, 3.2 and 4.3 %, by where the two walls lie against the grid’s diagonal planes through the cells’ centres; on the 250 Hz band’s grid eight more placements gave 1.9 % there (one-off checks).
The box’s band levels (the same listeners, windows and placements) are off by up to 0.3 / 0.5 dB in the 63 Hz band on its grid, 0.2 / 0.4 dB in the 125 Hz band and 1.1 / 1.2 dB in the 250 Hz band on theirs (first 100 / 300 ms), where walls on cell faces are 3.3 / 2.9, 2.4 / 4.6 and 4.0 / 3.7 dB off on the same stencil and the box with every side in whole cells, which is another box, 0.30 / 0.29, 0.10 / 0.26 and 1.02 / 0.49 dB.
The single wall, as above, on the 7-point stencil (dB rms in front of it, by cells per wavelength):
wall |
on cell faces: 8–16 |
16–32 |
32–64 |
fitted: 8–16 |
16–32 |
32–64 |
fitted, place fitted (cells) |
|---|---|---|---|---|---|---|---|
along the grid, 0.1 cell off a cell face |
0.34 |
0.21 |
0.10 |
0.02 |
0.00 |
0.00 |
+0.00 |
along the grid, 0.25 cell off |
0.89 |
0.53 |
0.24 |
0.03 |
0.00 |
0.00 |
−0.01 |
along the grid, 0.4 cell off |
1.47 |
0.85 |
0.38 |
0.01 |
0.00 |
0.00 |
+0.00 |
along the grid, 0.48 cell behind one |
1.81 |
1.01 |
0.44 |
0.04 |
0.00 |
0.00 |
+0.01 |
at 3 degrees to the grid |
1.17 |
0.41 |
0.23 |
0.04 |
0.01 |
0.00 |
+0.00 |
at 8 degrees |
1.01 |
0.09 |
0.04 |
0.12 |
0.02 |
0.00 |
+0.01 |
at 14 degrees |
0.69 |
0.20 |
0.06 |
0.18 |
0.03 |
0.01 |
+0.01 |
at 25 degrees |
0.55 |
0.18 |
0.09 |
0.25 |
0.04 |
0.02 |
+0.02 |
at 45 degrees |
0.32 |
0.12 |
0.09 |
0.26 |
0.11 |
0.08 |
+0.05 |
at 45 degrees, 0.2 cell behind a cell face |
0.59 |
0.43 |
0.27 |
0.40 |
0.16 |
0.12 |
+0.08 |
Along the grid fitted walls lie where the model has them, and against the source’s image in the cell face nearest the wall they are about as far off as walls on cell faces are against the model’s wall; at an angle the error grows with it.
Fitted walls: an L-shaped room. Its plan 2.4 x 2.0 m with a 1.0 x 0.9 m notch cut from a corner, 1.5 m high, every length rounded to whole cells, on the 125 and 250 Hz bands’ 7-point grids: its lowest mode (the plan’s) against the plan’s own problem written in the script (no flow through its walls, on squares), on squares of the grid’s cell (which walls on cell faces give within 2e-6) and in the continuum (from squares of 2.5, 1.2 and 0.6 cm extrapolated, carried through the grid’s time step: 63.35 and 64.41 Hz on the two grids’ rooms), % off the continuum’s, the room moved off the cell faces by parts of a cell along each axis:
grid |
moved (cells) |
fitted walls |
walls on cell faces |
|---|---|---|---|
125 Hz band’s (19.8 cm) |
0.311, 0.173, 0.457 |
+0.83 |
−1.42 |
0.05 along each axis |
−0.22 |
−1.42 |
|
−0.48 along each axis |
+0.83 |
−1.42 |
|
0.48 along each axis |
−1.20 |
−1.42 |
|
0 to 0.975 in steps of 0.025, and 0.499 and 0.501 |
−1.42 (at 0) … +1.01 (at 0.5) |
−1.42 |
|
250 Hz band’s (9.9 cm) |
0.311, 0.173, 0.457 |
+0.33 |
−0.50 |
0.05 along each axis |
−0.06 |
−0.50 |
|
−0.48 along each axis |
+0.35 |
−0.50 |
|
0.48 along each axis |
−0.44 |
−0.50 |
|
0 to 0.975 in steps of 0.025, and 0.499 and 0.501 |
−0.51 (at 0.499) … +0.41 (at 0.5) |
−0.50 |
Walls on cell faces put the room’s concave edge on whole cells, and lie below the continuum wherever the room lies. Fitted walls lie above or below it by where the edge falls within its cell, and jump by 2.31 % on the 125 Hz band’s grid and 0.89 % on the 250 Hz band’s as the edge crosses the planes of the cells’ centres (from 0.499 to 0.501 of a cell); just below those planes on the 250 Hz band’s grid they lie 0.01 % further below than walls on cell faces. At 0.05 the cube round the concave edge keeps a thin L of air, whose link the fit scales to the L’s volume; taken whole, it put the mode 3.3 % above the continuum on the 125 Hz band’s grid (a one-off check).
Fitted walls that absorb. A duct 0.3 m square on 10 cm cells, its far end 0, 0.25, −0.48 and 0.48 of a cell past a cell face, reflects off an end of admittance 0.25 and 0.5 within 0.010 of (1 − β)/(1 + β) with fitted walls (0.003 on cell faces); off an end of admittance 1, which reflects nothing in the continuum, 0.044 on a cell face and 0.061, 0.002 and 0.077 at the others (0.044 at every place on cell faces; the grid’s own reflection off a wall half a cell past the last cell centre is 0.02 to 0.09 at these frequencies, 40 to 200 Hz). An end of a material with a branch resonant at 100 Hz reflects within 0.003 of the grid’s theory for its admittance on a cell face, and 0.012 and 0.025 off it 0.25 and 0.48 of a cell from one (0.003 on cell faces), as the fitted update’s own analysis in one dimension gives (a one-off check). In the box turned by 8 degrees, its floor and ceiling of admittance 0.05 and its walls 0.02, the nine lowest modes decay at 0.992 to 0.999 of modal theory’s rate (from the update’s own terms, to first order), where walls on cell faces give 1.002 to 1.100; and with walls of the branch’s material the branch states weigh what the walls’ area says within 6e-9 (on cell faces, whose walls are the staircase’s squares, 11 to 16 % more).
Fitted walls over long runs. 200,000 steps of the L-shaped room on 10 cm cells with four plates in it (one turned 31 and 57 degrees, one level, two upright with a 3 cm slit between them), all turned 22.5 and 11 degrees, and of the box turned 22.5 degrees on the 19.8 cm grid: rigid, each keeps its oscillating part within 0.999 to 1.001 of the second block of 10,000 steps, its update’s coefficients are not below 0 and each cell’s sum to at most 2, and its largest eigenvalue is 3.95 and 3.96, under 4; the uniform pressure’s Rayleigh quotient is 2.3e-9 and 1.0e-9, so that it rings once in about 130,000 and 200,000 steps. With walls of admittance 1, or of 0.05 with a branch resonant at 60 Hz, the room falls below 4e-11 of its first block by the half and stays there. Open (its ceiling left out, in a grid with the matched layer), it falls to 9e-10 by the eighth block and then rises by about 1e-10 a block, to 2.1e-9 at the end: single precision’s rounding round the matched layer, which walls on cell faces show too (a one-off check).
Fitted walls: cost. Through the solver with two threads, the least of three runs (the script’s own machine, 4 cores shared):
model |
grid (cell) |
cells of air |
the fit (s) |
per step over the 7-point stencil on cell faces |
the 19-point stencil’s |
|---|---|---|---|---|---|
the box, 5 s of sound |
250 Hz band’s (9.9 cm) |
38,556 |
0.07 |
1.57 |
1.90 |
the church, closed, 0.25 s |
125 Hz band’s (19.8 cm) |
1,228,682 |
0.92 |
1.35 |
1.89 |
the leaky classroom, open, 0.25 s |
125 Hz band’s (19.8 cm) |
117,504 |
0.16 |
1.03 |
An open model is fitted twice: on the closed grid the solver tries first and on the grid with the matched layer. In one-off checks at 125 Hz with the examples’ own lengths, a run took 1.1 to 1.4 times as long as with walls on cell faces and the default stencil in seven examples, and 2.4 to 2.6 times in a small room holding a sphere of 5,120 faces, where the fit took most of the extra time (0.03 to 1.1 s on the examples, 13 to 18 s on a grid of 37 million cells). The set-up’s memory peaks while the model is fitted, at 2.7 (the church) to 4.1 times (a box of 37 million cells) that with walls on cell faces.
Fitted walls: one-off checks. Beyond the script:
Turned rooms with absorbing materials, 63 and 125 Hz bands, against the same room on cells half as large: the lecture hall turned 17 degrees within 0.43 dB (G) and 2.4 % (T20) with fitted walls; the studio turned 17 degrees within 0.40 dB, its 125 Hz T20 6.0 % and 4.7 % above at its two sources, 3 % unturned (the default grid, 8 points per wavelength at the band’s top, is coarse for its T20; finer grids approach the half-cell result smoothly). Walls on cell faces on the default grid were 0.05 to 1.75 dB (G) and 4.8 to 22.6 % (T20, always shorter) off the same reference.
A thin rigid screen behind which the level is read against the exact diffraction (Biot-Tolstoy-Medwin), 8 to 16 cells per wavelength: with its edge on a cell face, fitted walls are 0.15 dB rms off (walls on cell faces 0.73); with the edge inside a cell, 0.11 to 1.2 dB, more the higher the edge lies in its cell (on cell faces 0.26 to 0.70 dB): in the cell the edge ends in the fit leaves the screen out, so it acts as if it ended up to a cell lower and lets too much sound past.
A listener 0.2 to 1.5 cells from a rigid wall, against the exact field: along the grid and at 8 degrees fitted walls give the level within 0.40 dB and its gradient along the wall within 0.89 dB (walls on cell faces up to 2.29 and 7.96 dB); the gradient’s component normal to the wall, nearly 0 there, is up to 11.4 dB off with fitted walls and 13.8 dB on cell faces. Fitted walls’ errors hardly depend on where the wall lies in its cell, and walls on cell faces can be closer where their errors cancel: by up to 0.35 dB with the wall a quarter of a cell off a cell face, and by up to 2.8 dB in the normal component at 8 degrees.
Every indoor example checked (17 at 63, 125 and 250 Hz, every source; not the BIM office, which needs the
ifcextra) fits without a refusal; where its mesh is closed, its air volume is the mesh’s within 3e-16. Outdoor scenes are refused by design.Next to the matched layer a cell keeps its link to the layer whole where a grid without the layer would scale it: one more cell between the model and the layer changed the open classroom’s responses by up to 7e-4 of their peak (rms), at most 1.9 times as much as with walls on cell faces.
The fit gives the same arrays to the bit on every platform CI tests (Linux, Windows, macOS on Intel and on Apple silicon): a test compares their hashes.
On a GPU. validation/wave_gpu.py computes the wave bands (up to 125 Hz, 0.5 s) of
the first source of three example rooms to every listener on the CPU and on the GPU,
and compares the two. The tests do the same with resonant walls and with the matched
layer, in runs split so that the fields swap both ways between them, with both
stencils. On Mesa’s lavapipe, a Vulkan driver that runs on the CPU, with 4 cores (the
19-point stencil):
room |
cells |
steps |
CPU (s) |
GPU (s) |
largest difference |
|---|---|---|---|---|---|
studio |
10,350 |
1,016 |
0.2 |
1.5 |
2.8e-7 |
concert hall |
1,223,312 |
1,016 |
2.9 |
25.4 |
6.8e-7 |
church |
1,228,682 |
1,016 |
3.5 |
30.1 |
1.5e-6 |
The difference is relative to the largest pressure: the GPU’s single-precision
rounding, which stays at that level. Apple’s GPU, in CI, rounds further from the CPU:
in the test’s nearly closed room with resonant walls the two differ by up to 1.1e-5
after 1,601 steps, in the slow drift such a room builds up. These times are from an
earlier version of the script and include the grid’s set-up on the CPU (the same on
both) and, in the first room, the GPU’s start-up; the script now prints the set-up on
its own, the CPU’s and the GPU’s time steps without it, and the speed-up of the steps.
A software driver is no faster than the CPU solver; the script is there to time a
hardware GPU. With fitted walls (--walls fitted, the 7-point stencil, 1,516 steps) on
SwiftShader, another Vulkan driver that runs on the CPU, the three rooms differ by
7.4e-7, 8.4e-7 and 5.9e-7, and the tests’ closed and open rooms by 2.4e-7 and 1.5e-7
after 400 steps (one-off checks; the tests’ bar on a software driver is 1e-5).
Real-time convolver
The plan’s target: a 3 s response with 16 output channels (third-order Ambisonics), fed by one input in blocks of 128 frames at 48 kHz, without dropouts for 10 minutes. The benchmark sends 10 minutes of noise (225,000 blocks) through the convolver from Python, as the playback callback does, on one core of a 4-core x86-64 cloud machine with nothing else running, and times every block:
per block |
mean |
median |
99 % |
99.9 % |
max |
over the 2.667 ms budget |
|---|---|---|---|---|---|---|
thread CPU time |
0.127 ms |
0.096 ms |
0.248 ms |
0.295 ms |
1.175 ms |
0 of 225,000 |
wall-clock time |
0.128 ms |
0.097 ms |
0.250 ms |
0.305 ms |
3.663 ms |
1 of 225,000 |
The response is split into 16 partitions of 128 samples, 14 of 1024 and 16 of 8192, and
the work of the long partitions is spread over the blocks in between. The convolver’s
own work (CPU time) never took longer than a block lasts: on average 4.8 % of it, at
most 44 %. In wall-clock time, one block was late (3.7 ms), while no block’s own work
took more than 1.2 ms: the thread was kept off the core for a moment. On an earlier
run, on a machine shared with other work, 48 blocks of 225,000 (0.02 %) were late that
way. On a desktop with a real-time audio thread and the usual two or more buffers at
the sound card, such single late blocks are absorbed. Whether a given sound
card plays 10 minutes without a dropout can only be checked on that machine:
acoustic-spaces play ir.wav --live --block 128 --seconds 600 reports the longest time a block
took and every block the sound card dropped. The output matched offline convolution to 2.6 × 10⁻⁷ of
its peak (single precision).
Known issues
Reviews of the code found these, but for the one about barriers, which the checks against the exact solution found, and those about barriers in wind and a leg’s shadow, which their checks found. Each one was checked against the code; the numbers come from the tests or scripts named, and a number from a one-off check says so. They are open items on the roadmap. The edge fade’s own are listed in Known issues of the edge fade.
Results:
The first milliseconds of a rendered response. An impulse response is put together from its bands with zero-phase filters (
synthesis.combine_bands), which spread each arrival both ways in time, and what would fall before the response’s first sample is lost. For an arrival whose level differs from band to band, that changes its level in the low bands when it comes in the first milliseconds: a sound 1.5 dB lower at 125 Hz than at 63 Hz, 4.7 dB at 250 Hz, 10 dB at 500 Hz, 15 dB at 1 kHz and 20 dB from 2 kHz up gives a G 0.14 dB lower at 63 Hz 2.9 ms in than the same sound 200 ms later, and within 0.05 dB in the other bands; a sound of the same level in every band does not change (tests/test_coherent.py). The echograms, and the parameterssimulateprints and writes from them, are not affected; the parametersanalyzetakes from the WAV files are.The early order with vector-based scattering. Vector-based scattering (the default) sends each reflection along the sum of its specular direction and a Lambert direction, which leans towards the wall’s normal. The detector spheres count each reflection’s specular share along the exact specular direction, but from where that ray met the face: the first order’s share is the exact paths’, and the later orders’ leave the walls from other places than the exact paths and bring less energy to the listener. The early part replaces orders 1 to 3 with the exact paths, so the total depends a little on how many it takes: in a 4 x 3.5 x 3 m box (absorption 0.15, scattering 0.3), with the default
early.max_order: 3it is 0.02 to 0.05 dB lower than taking orders 1 to 9, and withmax_order: 00.04 to 0.13 dB lower, while taking the first order early or not moves it by under 0.03 dB (from 250 Hz up, four seeds). Random scattering keeps the specular share on the specular paths: within 0.02 dB either way (the room oftests/test_scattering.pywith its seed; the test’s bounds are looser, to allow for other seeds). A lobe centred on the specular direction would remove this, but changes the late part’s decay, which the default was chosen to match in the BRAS rooms.Pairs of paths from 1 kHz up. In the bands above 500 Hz that add in pressure (outdoors, 1 to 8 kHz), the echogram shares each pair of paths’ cross term between their two time slots, and a slot that would go below zero is set to zero (
coherent.pair_energy). That adds energy where paths cancel; a one-off check over the nine outdoor examples, when this was found, put it at hundredths of a decibel at most, in a band’s response and in the lateral figures of eight behind LF, LFC and LG. Impulse responses add the paths in pressure without it.Scattered sound near a listener in bent air. Where the rays bend in wind or a temperature gradient, scatter in plants before they reflect, or reach the listeners as secondary sources, the scattered sound of a reflection near a listener comes from the few rays that land there, not from the listener’s own gather: a run with a far source over a ground that scatters has bursts of it that change with the seed.
Paths over two edges take no reflections. With
second_ordera path over two edges reflects nowhere before, between or after them, so behind a thick barrier on a hard ground the engine has one of the four paths over it: 1.7 to 5.7 dB low from 500 Hz up, and off by up to 9.9 dB below (see Reflections that fade at edges). In sight just over a building’s roof the path over both of its edges has no copies off the ground either. In a one-off check against the package’s wave solver (8 points per wavelength), with the source and the listener 0.3 to 1.5 m above the roof of a building 4 m wide and 2 m high on a rigid ground, the early stage was within 0.9 dB at 125 Hz for a building 4 m long (three positions) and 1.9 dB high for one 40 m long (one position); at 63 Hz, where the building is also less than half a wavelength high, it was 0.5 to 6.6 dB low for the short building and 6.4 dB high for the long one (first_order: 3.8 dB low to 7.8 dB high at 63 Hz, 0.9 to 2.4 dB high at 125 Hz). The difference at 63 Hz is not traced further; the wave solver (simulation.wave) is the tool for those bands.Sound that just clears two edges in a row, without paths over two edges. Each edge the direct sound passes takes its terms off it, and with
first_order(the default) ordirectnothing gives back what two edges in a row take twice: where the source and the listener see each other just over both edges of a flat roof, a thick wall or two barriers, or along a wall in line with both, the level is too low. Over a top 10 m wide, the source 10 m before it and the listener 5 m past it, it is 12.6 to 20.7 dB low from 63 to 500 Hz a centimetre above the top’s plane, 6.4 to 0.9 dB half a metre above it, 2.6 and 1.0 dB at 63 and 125 Hz a metre above it, and within 0.7 dB two metres above it. Behind the top with the source above its plane the level is too high, the path over the far corner taking nothing off for the near one: by 5.7 to 5.9 dB with the source a centimetre above the plane and the listener half a metre below it, 5.1 to 4.2 dB with them 0.5 m above and 2 m below, and 3.4 to 0.1 dB with both 2 m off it.second_orderhas the path over both and is within 0.09 dB in all of these (see Edge diffraction against the exact solution); its reflected copies, off a ground, are missing as in the item above.More than two edges in a row near grazing incidence. A path bends over two edges at most (
second_order), so where sound just clears three edges or more in a row (three barriers, two flat roofs of one height, a roof with a slot across it), what their terms take off it more than twice is not given back. Just over three screens 5 m apart the level is 1.5 to 2.9 dB above that over two from 125 Hz up; a 2 cm slot across a 10 m top lowers the level by 0.6 to 1.1 dB; over three tops in a row it is 3.4 to 5.0 dB above that over one. Behind three screens with the source on the line of their tops and the listener 0.5 m below it, the path over the last top and the paths over each of the others and the last cancel: the level is at -20.8 to -54.3 dB where two screens leave -10.7 to -21.7 dB, and with the source 0.5 m above the line it is 9.1 dB (63 Hz) to 1.4 dB (8 kHz) below the two screens’. Behind two flat roofs 5 m wide and 5 m apart, the listener 0.5 m below their plane, the level up to 500 Hz is at -21.1 to -32.0 dB with the source a centimetre above the plane, at -18.4 to -15.7 dB with it 0.5 m above and at -9.9 to -4.1 dB with it 2 m above, where one roof 15 m wide, with no gap, leaves -6.2 to -8.6, -5.6 to -6.8 and -3.7 to -2.1 dB; with the source below the plane the two are the same. Withfirst_orderthe level a centimetre above two tops in a row is at -0.4 to -1.5 dB and above three at +4.9 to +5.8 dB, where one top leaves -5.3 to -5.9 dB. There is no exact solution for these in the report. One check against a two-dimensional wave calculation turned into a point source’s (on a 2 cm grid, within 0.05 dB of the exact solution over the 10 m top), up to 500 Hz, a centimetre above the plane of a flat top and a screen level with it: with the top 9 m wide and the screen 1 m past it the level is -6.3 to -6.9 dB, andsecond_orderis 3.2 to 5.8 dB below that (first_order0.3 to 2.5 dB below it); with the top 5 m wide and the screen 5 m past it, -7.6 to -8.4 dB,second_order2.3 to 3.4 dB below (first_orderwithin 1.3 dB), either way round with the rays’ own search for reflections. The level also steps with the height of the screen’s top at that plane, by 13 to 16 dB over 4 mm: past the 9 m top withsecond_orderand every sequence of reflections tested (method: image_sources), it is -13.7 to -19.0 dB with the screen’s top from 2 mm to a micrometre below the plane, -9.6 to -12.6 dB with it level or up to 0.5 mm above, and -0.3 to -1.9 dB from 0.55 mm above, from where the path over the screen’s top reflects off the top (0.53 mm above, it does so at the top’s far edge). Above 500 Hz, where the bands add in energy, the level is -10.0 to -10.2 dB with the screen’s top level and -5.6 dB with it a micrometre above. With it 10 µm to 0.5 mm above the plane and the rays’ own search, the two ways round are also up to 0.4 dB apart. A solver for whole rows is in the package, within 0.38 dB of wave calculations near grazing incidence in free space (see Rows of roofs and barriers against a wave calculation). An outdoor scene takes the sound over the tops of its barriers and buildings from it in the bands up to 500 Hz; the levels here are those of the paths over the edges, which stand withsimulation.early.rows: edges, in coverage maps and walks, near the ends of a top and over a model file’s objects.Exactly in the plane of several tops in a row. With the source and the listener both exactly in the plane of two flat roofs of one height, or of a roof and a barrier’s top, the paths over one edge and over two do not add up as they do just above it. The level is 3.9 to 9.2 dB below that a centimetre above the plane of two tops 5 m apart, 2.5 to 6.9 dB below it over three tops, 1.4 to 5.4 dB below it with a 2 cm slot across a 10 m top and 2.8 to 5.3 dB below it over a screen and then a top; over a top and then a screen it is within 1.7 dB of it (in pressure up to 500 Hz and in the bands that add in energy). Within two millionths of the model’s size below that plane, the rays that look for paths over edges, which start a millionth of it off the edges, find paths that the tops hide: the level is then 9.4 to 9.7 dB above that a centimetre below the plane of two tops, 15 dB above it for three tops, and 8.9 to 9.9 dB behind a top and a screen in either order. Within that distance above the plane they miss paths that are there: a millimetre above the tops of three screens 5 m apart, the last of which ends a centimetre beside the way, the path round that end is not found and the level at 63 Hz is 1.5 dB below that 3 mm above them. Likewise above a roof 5 m wide and a screen level with it, 5 m before the roof or past it, that ends 1 cm to 0.1 m beside the way: the term of the screen’s upright end for the direct sound is missing up to 1.2 or 1.8 mm above the plane, where the level up to 500 Hz is 0.2 to 0.6 dB below that a centimetre above (0.5 to 1.1 dB with the way 1 cm outside the end).
Reflections level with several tops. With the source and the listener exactly level with the tops of two screens, the level is that just above the line for the direct sound and for a first reflection that passes level with the tops too (see Edge diffraction against the exact solution). The terms that make reflections fade at edges, which have the reflections of second order and up, count each top for the whole of one that passes level with both: with a wall 2 m behind the source, which sends such reflections off the first screen and the wall, the level on the line is 4.6 to 5.7 dB above that 1 mm above it (11.5 to 13.4 dB above it before, when each top stood for all of the direct sound and of the first reflection as well).
A way through a corner of a flat top. Where the straight way between the source and the listener, both in the plane of a flat top, passes exactly through a corner of the top (a box turned so that only its corner touches the way), no ray finds the direct sound and no path over the top’s edges stands for it: over the box alone there is no sound at all, where a millimetre above the plane the level is at +0.6 to -3.0 dB. With a screen on the way too, its paths are all there is: where a screen ends on the way 7 m before the corner, the level is 8 to 28 dB below that a millimetre above the plane (the screen’s paths stood for the direct sound there before, within 2.2 dB of it).
A slight bend of a barrier. Where a barrier’s top goes on in another across a bend of less than a degree in plan, neither edge fades at the joint, and the point a path touches can fall past the end of both (no path over the top) or on both (two paths). Behind a barrier with a bend of 0.95 degrees, the source 10 m before it and the listener 15 m behind it, the level on a strip beside the plane through the bend is nothing at all or 6.0 dB too high, as the bend turns: the strip is 1 mm wide with both 2 m below the top, and 4.6 cm wide with the listener 20 m below it. Bends of a degree or more fade (see Edge diffraction against the exact solution).
Two separate edges in each other’s transition zones. A path over two edges takes the product of the two edges’ coefficients, the second’s with the curvature of the first edge’s wave. Where the second edge stands in the transition zone of the first and no face joins them (two screens in a row, near grazing incidence over both), that leaves too little at high frequencies: a quarter of the free field just below the line of two tops 10 m apart, where two knife edges leave 0.317 of it, 2.1 dB low from 2 kHz up, and 1.0 to 1.3 dB low just above it. As the source or the listener alone crosses the line of the tops, the level steps by 0.5 and 1.0 dB at 63 Hz. The corners of one block or wall, joined by a face, are not affected.
A barrier’s end in wind. Behind a barrier the paths in the plane take the barrier’s effect, and the paths over the top past its end, as they fade out there, take it too; the paths round the end change as the open ground’s field along their way unfolded does from the straight direct sound and ground reflection in still air to the weather’s, so that at the end’s shadow boundary they jump by the open ground’s field, as the direct sound does. 1 mm either side of the boundary in the
windypreset (a barrier 4 m high 15 m from a source 1 m up, listeners 1.5 m up) the level steps by at most 0.04 dB in octave bands 60 m down- and upwind and 0.07 dB 120 m downwind, but 120 m upwind by 0.22 and 0.20 dB at 250 and 500 Hz, where still air steps by 0.17 and 0.08 dB; in third octaves by 0.28 dB 120 m downwind (in the 50 Hz one, where still air steps by 0.30 dB). With eddies it steps more at 4 and 8 kHz, and in still air the same eddies step across the boundary too (largest step, dB, 1 mm either side; in wind at 4 and 8 kHz, the lower bands as without eddies):eddies
wind, 60 m
wind, 120 m
still air, 60 m
still air, 120 m
weak
0.02 and 0.01
0.03 and 0.10
0.19 at 4 kHz
0.27 at 8 kHz
moderate
0.08 and 0.02
0.13 and 0.34
0.60 at 4 kHz
0.29 at 4 kHz
strong
0.11 and 0.01
0.49 and 1.08
0.95 at 4 kHz
0.81 at 2 kHz
The eddies ease the decorrelation only of two paths with the same walls and edge (
Eddies.wander), and a path round the end shares neither with the open ground’s path it stands for nor, in still air, with the direct sound: with that easing taken for every pair the step is at most 0.04 dB in still air (strong eddies, 60 m) and 0.01 dB at 4 and 8 kHz in wind. With weather zones (a zone from 30 m on with 1 m/s of wind, 60 m downwind) it steps by at most 0.04 dB up to 2 kHz but by 0.20 and 0.76 dB at 4 and 8 kHz, where the eigenrays take the mean of the weathers along their way: those shares, sampled every metre of each leg, come out 0.495 for the way round the end and 0.49 along the listener’s line (0.5 exactly); sampled every millimetre, the step is 0.00 dB at 4 and 8 kHz. At a building’s corner the paths round its vertical edge stop where they would touch it above the roof, the edges of a box’s corner stopping as an endless edge would: past a building 6 m high (x 20 to 30 m, the source at the origin 1 m up) a listener at (60, 28) rising past that point (15.808 m up) steps 1 mm by 1.3 to 3.0 dB in still air and by 0.7 to 2.6 dB in thewindypreset downwind, where the copies of those paths stop with them. 60 m downwind the level on the boundary is the open ground’s less 6.12 to 5.83 dB from 250 Hz to 8 kHz (half the field, 6.02 dB, for a half-plane; 6.48 to 5.74 dB in still air) and 1 m into the lit side within 0.32 dB of the half-plane’s Fresnel factor from 1 to 8 kHz. 60 m upwind at 4 and 8 kHz it is the open ground’s less 1.78 dB and plus 4.30 dB with the default frequencies, but less 1.56 and 4.13 dB with 8 an octave in the runs: it depends on the frequencies they take. Where the end stands below the line of sight (a barrier 1 m high 30 m from the source), a listener 100 m away crossing the end’s line seen from above, from the barrier’s effect to the open ground’s sound, steps 1 mm across it by up to 0.94 dB from 63 to 250 Hz, 4.7 dB from 500 Hz to 2 kHz and 7.7 and 12.8 dB at 4 and 8 kHz upwind; 200 m away by up to 0.57 dB from 63 to 250 Hz, 6.0 dB from 500 Hz to 2 kHz (downwind) and 1.1 dB at 4 and 8 kHz. Both are two estimates of the same field that disagree, not a missing blend. In a deep upwind shadow the barrier’s own runs at 4 and 8 kHz and the open ground’s shadow there (deepened from the 2 kHz band’s) are 12 and 40 dB apart (a barrier 5 cm high across the whole way 100 m upwind raises those bands by as much). From 500 Hz to 2 kHz it is the barrier’s side: 200 m downwind, 0.5 mm behind the end’s line, the wind’s effect is the open ground’s own there (the barrier moved aside) less 5.8 dB at 500 Hz and plus 6.3 dB at 2 kHz, from the barrier’s runs on the paths in the plane, while 0.5 mm on the open side it is within 0.26 and 0.82 dB of it and the paths round the end follow it within 0.14 dB on both sides. Where the end’s top comes onto the line of sight (200 m downwind, 0.5 m either side of the end’s line, the listener rising past 1 m) the paths round it of the direct sound’s kind stop, and the level steps 1 mm by up to 4.3 dB from 500 Hz to 2 kHz and 3.9 dB at 8 kHz (0.16 dB in still air): the paths round the end step there as in still air (6.0 and 5.9 dB at 1 and 2 kHz) and the other paths against them, which cancels in still air; in wind the two weigh differently, by the disagreement above, and 1.8 and 4.3 dB are left at 1 and 2 kHz. In a breath of wind (0.05 m/s) the paths round the end share the open ground’s own departure from still air, its equation’s ground fitted from the absorption near grazing against the image sources’ reflection: 60 m downwind on the boundary by -0.07 to -0.86 dB from 63 Hz to 2 kHz and +0.62 dB at 4 kHz (10 m into the lit side as much, 10 m behind up to 0.27 dB), over grass, whose impedance both share, by at most 0.21 dB.A model file’s object in wind. The parabolic equation’s runs behind barriers and buildings cannot hold the model file’s objects, so where one stands in the way the paths over its edges keep their straight legs, and the bent direct sound and its ground reflection are there where the straight ones are: the edges’ terms, made for the straight paths, do not follow the bent rays’ times and levels. Walked in 10 cm steps across the shadow boundaries of a wall 4 m high 15 m from a source 8 m up in the
windypreset, down- and upwind, the weather’s effect steps across the direct sound’s boundary by at most 0.13 dB in octave bands and 0.2 dB in third octaves, and across the ground reflection’s by up to 0.59 dB at 250 Hz upwind and 0.8 dB at 2 kHz downwind in octave bands and 2.5 dB at 250 Hz in third octaves (a one-off check;tests/test_barriers_in_wind.pybounds octave bands from 63 to 500 Hz). A source or a listener on a building’s roof takes the equation with the building inside, as behind barriers and buildings, where those steps are gone (see Continuity); there the narrow-angle march from the roof and the one to it differ by up to 0.22 dB at 8 kHz 42.5 m away (0.7 dB in third octaves), the wide-angle one by 0.03 dB.Where the runs from a roof take over. Nearer than 1.5 times the source’s and the listener’s heights above the ground added, the paths over a roof’s edge keep their straight legs, which leave out the weather’s effect close behind it: 12.75 m from a source 1 m over a roof 6 m high, listeners 1.5 m up (and the two swapped), the effect steps by up to 0.12 dB in 2 cm (0.10 dB at 125 Hz, where the full-wave solution’s is 0.08 dB), down- and upwind, in either setting of the equation. Measured from the roof, that distance would put the runs close behind the wall, where the wide-angle equation is up to 0.26 dB off the full-wave solution at 250 Hz 6 m from the source and the runs’ frequencies fall in step with the ground’s fringes 11.5 to 12.4 m away (up to 2.9 dB at 8 kHz, 0.11 dB with 64 frequencies an octave).
A barrier’s end seen from a roof. On the lit side of the shadow boundary of a barrier’s end the roof’s near edge diffracts the direct sound and its ground reflection, but no path goes round the end and then over that edge, so that 1.5 m over a roof 6 m high 45 m from a source 1 m up the level steps 1 mm across the boundary by up to 2.79 dB in still air (at 250 Hz; by up to 0.05 dB with no building). In wind the paths round the end take there the lit side’s runs with the building inside, the paths over the barrier’s top those with the barrier too, and with the roof edge’s paths stepping the weather’s effect steps by up to 0.37 dB downwind and 0.57 dB upwind at 500 Hz, and by up to 1.28 dB in the 400 Hz third octave; without the roof edge’s paths it steps by at most 0.02 dB (0.07 dB in third octaves;
tests/test_barriers_in_wind.py). Diffraction to the second order leaves the still-air step (3.53 dB at 250 Hz). A path round the end and then over the roof’s edge would keep its straight legs in wind as the paths are routed now (it goes round a vertical and then a horizontal edge), while the lit side’s paths over that edge take the building’s runs, so supplying it in still air alone would not be known to remove the step of the weather’s effect: that is not measured. In other cases (one-off checks): 0.8 m over the same roof the weather’s effect steps by 0.82 dB at 4 kHz (still air by 5.76 dB at 125 Hz); with a barrier 8 m high and the source on the roof by 0.69 and 1.15 dB at 250 and 500 Hz; and where a second building 4 m high stands with its corner’s top 0.17 m under the line of sight from a source on a roof, by 3.3 and 4.5 dB at 1 and 2 kHz (up to 6.5 dB with the two swapped): there the direct sound’s own runs step as the way to the listener takes in that building at its footprint’s corner (their effect goes from 0.97 to -2.29 dB at 250 Hz), and the paths over its roof’s edge past the end keep straight legs.A caustic in the rays’ bands. Over the open ground in wind or a temperature gradient the bands above the parabolic equation’s (4 and 8 kHz) come from the eigenrays, and where two of them merge (a caustic) each is capped at 10 dB over a straight path’s on one side and both are gone on the other, with no transition (Airy) zone between: the level steps by 11.1 and 12.9 dB at 4 and 8 kHz between listeners 1 cm apart 119.86 and 119.87 m downwind in the
windypreset (a source 2 m and a listener 1.5 m up over grass), and by 10.5 dB at both between 2.04 and 2.05 m up 250 m away inclear_night(a source 0.5 m up), where up to 2 kHz the level changes by at most 0.05 dB a centimetre (tests/test_refraction.py, a one-off check at 4 and 8 kHz). Withsimulation.early.open_ground_frequencies: raysthe rays give 1 and 2 kHz too short of half the way to the shadow, and those step at the same caustics by 10.5 and 12.0 dB in the wind and by 14.0 and 7.2 dB on the clear night (a one-off check). In one-off checks againstvalidation/ffp.py’s fast field program on twelve walks over the open ground (a ground of 200 kPa s/m² by Delany and Bazley’s model with a scattering coefficient of 0, image sources to the first order, no diffraction; inwindy20 to 400 m from the source, downwind from a source 1 m up to listeners 1.5 and 3 m up, from one 3.5 m up to 1.5 and 3 m, from one 7 m up to 1.5 and 7 m and from one 2.5 m up to 2.5 m, 60° off downwind from a source 2 m up to listeners 1.5 m up, and downwind over a ground of 20000 kPa s/m² from a source 1 m up to listeners 1.5 m up; inclear_nightlisteners 0.2 to 6 m up 150 and 300 m from a source 1.5 m up and 200 m from one 0.8 m up), the level steps on eleven of them where paths appear: between listeners a centimetre apart, placed where the level changes most between listeners a metre apart (all the way up on the clear night), the largest change on each is 7.2 to 15.5 dB at 4 kHz, where the program’s level changes by 0.04 dB at most (6.5 to 15.1 dB at 8 kHz). On ten of them two paths appear there together; on the walk from 1 m up to 3 m up the engine finds one of the two from 200.99 m and the other from 208.40 m, where the level steps again, by 2.5 and 3.1 dB at 4 and 8 kHz. At listeners a metre apart (a centimetre apart in height on the clear night) the 4 kHz band of the eleven is rms 0.9 to 2.1 dB from the program and at its worst 4.0 to 15.2 dB above it, within a metre of such a step on the side of the paths it adds. On the twelfth (the source 7 m and the listeners 1.5 m up), where the 4 kHz band changes by 0.49 dB at most between listeners a centimetre apart all along the walk, it is rms 0.14 dB from the program and at its worst 0.54 dB below it. On a thirteenth withrays(a source 3.5 m and listeners 1.5 m up inwindy, 15 to 400 m downwind), the 1 and 2 kHz bands are rms 1.0 and 1.1 dB from the program at listeners a metre apart and step by 8.2 and 9.1 dB.A wall’s reflection in wind and temperature gradients. There the paths off a façade or a barrier’s face are eigenrays in every band, where the open ground’s own sound is the parabolic equation’s up to 2 kHz by default: such a reflection steps at its rays’ caustics in every band, and up to 2 kHz its ground effect is the rays’. In one-off checks in
clear_nightwith the default early settings, a source 1 m and listeners 1.5 m up over a ground of 200 kPa s/m² by Delany and Bazley’s model, 5 m beside a rigid wall 40 m high along their way (from 40 m behind the source to 340 m ahead of it; scattering coefficients of 0), againstvalidation/ffp.py’s fast field program, its direct sound and that of the source’s image in the wall added in pressure (an endless wall): from 50 to 150 m, at listeners a metre apart, the 63 and 125 Hz bands are rms 0.67 and 0.51 dB from it and the 500 Hz band rms 4.74 dB, 10.4 dB above it at 150 m; at the caustic of the wall’s rays 166.6 m away every band steps within a centimetre, by 6.1 dB at 2 kHz to 19.4 dB at 500 Hz; and from 168 to 300 m the 500 Hz band is 12.5 dB above the program on average. Without the wall the same listeners, 50 to 300 m away, are within rms 0.11 dB of the program’s direct sound in every band up to 2 kHz.Other listeners in a listener’s direction behind barriers, in wind and temperature gradients. Behind a barrier or a building the listeners and map points that a source’s sound goes the same way to share a run of the parabolic equation under one absorbing layer, which begins above the highest of them, and part of the sound that the obstacle’s top sends steeply up comes back down, by where the layer begins. In one-off checks a listener 40 m from a source 1 m up, behind a barrier 4 m high 15 m from the source in the
windypreset, moved by 0.0013 dB with two more 80 m away, one of them 10 m up. One 15 m from a source 0.5 m up, behind a barrier 7.43 m high 4 m from the source over a rigid ground, downwind in a wind of 10 m/s at 10 m, moved by 2.0 dB at 2 kHz with another 290 m away, and by 2.1 and 2.4 dB at 2 and 4 kHz with another 60 m away, 23 m up; alone, its 2 kHz band stayed within 0.25 dB under ten of twelve layers set to begin 21 to 240 m up and was 0.4 and 2.0 dB under their mean under those beginning 36 and 43 m up, and 0.02 dB under it under a layer twice as thick beginning 43 m up. Over the open ground a listener reads the same alone as among others (see The wide-angle parabolic equation).What the equation’s field through the crossovers does not mend. Between its samples (59 Hz apart in the 2 kHz band) the field is drawn linearly in the complex pressure, within h^2 / 8 times the sum of |a_i| (2 pi dtau_i)^2 for arrivals a_i dtau_i away from the field’s own delay (
engine/fine.py’sinterpolation_boundreads it from the samples); a field that turns by half a period or more from one sample to the next is not resolved. 300 m downwind inwindythe equation’s dip to -10.1 dB at 2225 Hz reads -9.9 dB; 1 km downwind the estimate is 0.3 to 0.55 of the band’s level in its bands from 500 Hz up, and the equation’s dip to -27 dB at 2090 Hz is drawn at -50 dB 10 Hz below it (a one-off check). In the weather presets the rays’ band above the top crossover (2.4 to 3.4 kHz) is 5 to 22 dB off the equation inside it, 100 and 300 m downwind inwindyand on the clear night, while the equation’s bands follow it within 0.8 dB. Against the bands’ own samples, whose two errors there partly cancel, the response in the crossover comes closer to the equation inwindy(rms 7.2 to 3.3 dB 100 m away, 4.3 to 3.1 dB 300 m away, though 3.6 dB further at 3010 Hz) and goes further from it on the clear night (rms 1.4 to 1.8 and 1.2 to 1.7 dB, up to 2.4 dB further at 3075 Hz 100 m away; a one-off check). So it does in case 2 with the source 1.5 m and the listener 1 m up, 300 m away, where the rays’ band is 2.8 dB low at 3.45 kHz: up to 0.42 dB further from the program at 2.8 to 2.95 kHz, though closer over 2 to 3.45 kHz (worst 4.0 to 3.0 dB, rms 1.8 to 1.6; a one-off check). In the shadow the bands keep their own samples, since the bands above the equation, deepened from the octave below, are not continuous with its field: 18 dB (upwind inwindy100 m away) to 36 dB (sunny_day300 m away) louder than it at 3.4 kHz. In case 3, 300 m away, where they are within 0.3 dB of the equation at 3.4 and 3.9 kHz, the response in the crossover is 8.6 dB below the program at 2.95 kHz. The paths round a barrier’s end or a building’s corner take their way’s runs at every frequency too, with each path in still air drawn between its own frequencies (within 0.18 dB and 0.9 degrees of the same path at 24 frequencies an octave from 0.7 to 4.5 kHz), and 60 and 120 m away, downwind inwindyand in case 2 over a Delany-Bazley ground of 200 kPa s/m², their rendered third octaves through the crossovers are within 0.03 dB of runs 27 times as dense (over an absorption of 0.02, 0.34 dB at 800 Hz 2.6 m up, as far as the way’s own field is off its dense run there; withopen_ground_frequencies: rays0.18 dB at 400 Hz, where the band energies over 8 frequencies an octave leave the listener’s own field 0.10 dB off). Below an end’s line of sight, where the straight paths along the way all but cancel, they keep the weather’s effect at the early paths’ frequencies (100 m downwind inwindy, within 0.01 dB of the dense runs in the 2 and 2.5 kHz third octaves but up to 1.1 dB off them in the crossovers); the paths over a roof’s edge and behind barriers still take one ratio of the equation’s band energies a band through them (a one-off check).A ground given by absorption coefficients in wind. The parabolic equation (the bands up to 2 kHz in wind and temperature gradients) takes such a ground as a locally reacting surface of the real admittance fitted to its absorption (
engine/impedance.py’sfit_admittance: 0.003 for 0.02, 0.051 for 0.3), whose reflection goes to -1 at grazing incidence and adds a ground wave; still air’s image sources reflect off it with the square root of (1 - its absorption) at every angle and that admittance’s plane-wave phase, as off a floor. So a breath of wind (0.05 m/s) moves the level, intests/test_barriers_in_wind.py’s scene without its barrier (scattering 0, a listener 1.5 m up 60 and 120 m away), from 63 Hz to 2 kHz by -0.15 to -1.08 dB from a source 1 m up over an absorption of 0.02 (-0.11 to -0.81 dB from 5 m up), and over 0.3 by up to +18 dB at 63 Hz from 1 m up (-4.8 to +1.8 dB from 5 m up). Each against the fast field program over a locally reacting ground of that admittance in its own air (still, and the scene’s wind), the equation is within 0.05 dB in every band of these cases, and the image sources are 0.10 to 0.91 dB above it over 0.02 and up to 18 dB off it over 0.3 (63 Hz, 60 m, from 1 m up); the bending itself, the program’s breath against its still air, is at most 0.11 dB of these moves but for 0.31 dB at 2 kHz 60 m from the source 1 m up and 0.38 dB at 1 kHz 120 m from 5 m up. The rays’ bands, whose reflections take the image sources’ rule, move with the bending alone: +0.62 dB at 4 kHz 60 m from the source 1 m up, where the ground reflection comes 4.0 µs later against the direct sound than in still air and 0.16 dB louder, by the first interference dip (3.4 kHz), and +2.2 dB at 8 kHz 120 m away (a one-off check). The paths round a barrier’s end follow the equation through the crossover too: on an end’s shadow boundary 60 m away (the source 1 m up, absorption 0.02), the 3.15 kHz third octave of those paths moves by -0.56 dB at 0.01 m/s and -1.92 dB at 0.05 m/s against still air, the open ground’s by -0.57 and -1.93 dB, and the fast field program’s, in the scene’s own wind and over that admittance, by -0.36 and -1.78 dB (its still air 0.27 dB below the image sources’). Outdoors give the ground an impedance (The ground and the sky).The eddies downwind. The eddies’ coherence factor was fitted in still air and in the shadow (see Turbulence); downwind it is checked only here. In
windywith thestrongeddies, over grass with a scattering coefficient of 0, a source 5 m and a listener 1.5 m up, the eddies raise the 1 kHz octave band by 0.33, 0.60 and -0.34 dB 100, 200 and 300 m away, where the engine’s narrow-angle parabolic equation marched at the band’s 24 frequencies through 224 fields of these eddies (drawn as byvalidation/turbulence.py, Cn² the same at every height) raises it by 0.62 ± 0.24, 2.39 ± 0.34 and 0.67 ± 0.34 dB (95 % confidence): 0.3 to 1.8 dB apart (a one-off check). Since the eddies add the rays’ energy into the equation’s bands, a step of the rays’ at a caustic comes through: in the same case, between 335.9 and 336.0 m away, the 125 Hz to 2 kHz bands step up by 1.8 to 8.1 dB with thestrongeddies and 0.5 to 6.2 dB with themoderate, where without eddies they move by at most 0.008 dB.The eddies in a band’s echogram. Up to 500 Hz, where the early paths’ energy over time is read through each band’s filter, each two paths’ product still takes their coherence factor as its mean over the band’s frequencies, where the band’s level takes it at each frequency. In still air with the
strongeddies, a listener 1.5 m up over grass with a scattering coefficient of 0, the 500 Hz octave band’s echogram so sums to 0.02 dB more 50 m from a source 5 m up, and 0.06 and 0.12 dB more 100 and 200 m from one 10 m up, than with the coherence taken at each frequency (0.005 dB over asphalt at 100 m; within 0.05 dB from 63 to 250 Hz, and within 0.01 dB in third octaves at 100 m; a one-off check).A ground’s scattering coefficient in wind. The parabolic equation’s bands over the open ground (63 Hz to 2 kHz in wind or a temperature gradient) keep a ground’s whole reflection, while the rays and still air’s image sources keep sqrt(1 - s) of it at each bounce, s the ground’s scattering coefficient. Over a ground with a scattering coefficient of 0.1 this steps the level by 0.075 and 0.122 dB more at 1 and 2 kHz over grass (0.196 and 0.151 dB over asphalt) where the rays take over with
open_ground_frequencies: rays(1 m/s of wind upwind, a source 10 m and a listener 1.5 m up, between 90.8 and 90.9 m away), takes 0.11 to 0.14 dB from the 4 and 8 kHz bands but nothing from the 2 kHz band beside them (the same weather, 90.4 m away), and changes by up to 0.23 dB how far a breath of wind is from still air (0.05 m/s, a source 2 m and a listener 1.5 m up, 50 m away, 63 Hz to 2 kHz). With a scattering coefficient of 0 only the models’ own differences remain: up to 0.08 dB at the hand-over, and between still air and the breath up to 0.06 dB from 63 to 500 Hz and 0.13 dB over grass and 0.19 dB over asphalt at 1 and 2 kHz (a one-off check;tests/test_refraction.pyholds the equation’s bands the same with 0 and 0.1).The late part of a band read through its filter outdoors. Between the equation’s samples h apart (11, 22 and 44 Hz in the 125, 250 and 500 Hz octave bands) a band’s spectrum is drawn linearly, which weighs the response about the field’s delay by sinc^2(t h) and repeats it faintly every 1/h: what comes 1/(2h) later is 7.8 dB down, later still more, and images come in. Where C50 and C80 are 50 to 88 dB, the late part that far below the early sound, they so read up to 8.1 dB off runs of the equation 27 and 81 times as dense, read the same way, 100 m downwind in case 2 and 200 m downwind in
windy(the bands’ own samples up to 13.6 dB off); closer than those in every case but C80 at 500 Hz, 6.5 to 7.5 and 2.3 to 4.8 dB off against 4.6 to 5.5 and 0.3 to 2.2 dB, where the two dense runs differ by 0.9 and 2.6 dB. The dense run’s own field, drawn on a 0.12 Hz grid and read through the same octave filters outside the response’s synthesis, gives its C50 and C80 at 250 and 500 Hz within 0.1 dB in case 2 and 0.3 dB inwindy. What cuts the late part differs by the case: in case 2 mostly the 500 Hz band’s own samples (those alone at their own spacing move its C80 from 82.0 to 91.3 dB, the bands from 1 to 3.4 kHz alone to 83.8 dB), inwindythe bands from 1 to 3.4 kHz, which the 500 Hz filter reads through its skirts (alone they move it from 73.1 to 84.6 dB). Denser samples close it only slowly: C80 at 500 Hz in case 2 reads 88.5, 95.2, 87.3, 81.9 and 81.0 dB with 1, 3, 9, 27 and 81 times as many from 63 Hz to 3.4 kHz (a one-off check).Coverage maps behind barriers read the high bands higher than a listener at the same point: 130 m behind two barriers over grass by 0.6, 1.3, 3.8 and 13.5 dB at 1, 2, 4 and 8 kHz, in still air as in 8 m/s of wind, where the weather’s effect is the same in the map and at the point (a one-off check).
Near a shadow boundary, in the bands that add in energy. There the term of the edge’s incident wave is part of the direct sound’s wave, and the terms of the reflections off the edge’s faces, which arrive with it, are part of the edge’s diffracted wave, which adds to it in energy: their cross term is lost. On the shadow boundary of a right-angled corner the level is 1.73, 1.32 and 0.98 dB low at 250, 500 and 1000 Hz and 0.72, 0.52 and 0.38 dB at 2, 4 and 8 kHz; behind a blunter edge more, 2.22, 1.79 and 1.38 dB at 250, 500 and 1000 Hz and 0.56 dB at 8 kHz behind a wedge open over 225°; behind a thin screen less, 0.69, 0.50 and 0.36 dB at 250, 500 and 1000 Hz; 10.5° into the shadow, 1.05 dB at 250 Hz behind the corner, 1.12 dB behind the wedge and 0.45 dB behind the screen (see Edge diffraction). These bands add in energy indoors from 250 Hz up by default; in pressure, as the 63 and 125 Hz bands and outdoors every band do by default, the level is within 0.08 dB. Keeping the cross term, weighted by how coherent the terms are over the band, would remove it. Likewise where the source or the listener crosses the plane of a top that the other sees from above: the path over both of its edges continues the path over one below the plane and gives back what both edges take above it, and its pieces add up differently in energy on the two sides. Half a metre above a 10 m top the level steps by up to 1.1 dB as the other of the two crosses the top’s plane (by 1.5 dB at a gable roof’s slope in a one-off check), and by 0.01 dB in pressure. Over a top 1 m wide absorbing 0.5, the level 0.3 m above its plane was 0.56 dB above the rigid top’s at 4 kHz (a one-off check).
Surfaces a hair off the wave solver’s cell centres. The wave solver takes a surface within 1e-10 cells of a plane of its cell centres to lie on it (see Simulation). Close to that distance, but not on it, cells and links can still be placed wrong (one-off checks on prisms, a tetrahedron, a wedge, an octahedron, a box and a screen in a 4 m room, 0.1 m cells, both stencils). A face 1e-10 cells off a plane of centres, to within the rounding of its offsets (about 1e-14 cells in that room; the rounding grows in proportion to the distance from the grid’s origin), can put the cells of that plane under it on the wrong side: with one slanted face of a tetrahedron so placed, the 174 centres of that plane inside it were air, and listeners 1.3 and 3.4 cells from the face read 0.47 and 0.50 of the response off. Where every face of a closed object lies so, the object can be read as air throughout (those runs checked, 4000 steps, stayed bounded). Where a flat side made of two triangles ends on a plane of centres, a centre on the side’s end edge from 1e-10 to 1e-10 / (2 sin a) cells past that plane, a being the angle between the side’s diagonal and its edges that leave the plane (tan a is the side’s width over its length), can be held by one triangle and not by the other (seen on prisms along x and along y, on none along z): for a long, narrow side about length / (2 width) x 1e-10 cells, 1.8e-9 cells for a side 1 cell wide and 36 long. A few boundary cells and links then move, no air cell, and a listener beside it read up to 0.16 of the response off. Where a face at 45 degrees to the axes lies 7e-11 to 1e-10 cells off a plane of centres, a link that meets it across its diagonal is cut (1 boundary cell, 2 to 6 links). A box 6e-11 to 3e-9 cells past planes halfway between centres has 42 of its 46662 19-point links cut by its edges (0.026 of the response). A screen whose plane and rims round to different sides of 1e-10 cells gives up to 0.11 of the response on the 19-point grid. Past 1.3 million cells from the grid’s origin, rounding moves some ties out of reach (16 of 32 tied links of one scene). With fitted walls (
simulation.wave.walls: fitted) none of these arise: the fit decides every side exactly. Its own sudden changes are the next item.Sudden changes with fitted walls. With
simulation.wave.walls: fitted, a cell is stepped where its centre lies in air, and a piece of air that holds no cell centre is stepped with the neighbouring cell it shares the most open area with. A face that crosses a plane of the cells’ centres takes centres from air to solid or back, and the response changes suddenly there: the L-shaped room’s lowest mode by 2.3 % on the 125 Hz band’s grid and 0.9 % on the 250 Hz band’s (validation/wave_walls.py), and the response of solids whose faces pass through cell centres, moved by 1e-7 of a cell, by up to 0.34 of its peak (one-off checks, the solver’s own pulse, which reaches the top of the grid’s band). Where two cells share a centreless piece alike to within 1e-12 of a cell face, the one with the lower index takes it, and a model moved through that choice changes the response suddenly too: by up to 0.25 of its peak in a one-off check, a solid with faces at 45 degrees moved by less than 1e-12 of a cell from where they lie alike against the grid. Any rule that gives each piece of air to one cell changes suddenly where its choice changes; sharing such pieces among their neighbours would remove it. Where a solid’s convex edge whose faces lie a hair inside the grid’s planes meets a face off them (a corner of a box), the response changes by up to 0.05 of its peak (0.07 dB in a band) as those faces leave the planes, where along the rest of the edge it changes continuously (a one-off check): a rule for the depth of air behind each such link would remove it. A closed chamber thinner than a cell, joined to a cell through a hole much smaller than a cell face, nearly closes that cell’s link on the other side, as if the chamber were a sliver of the cell’s own; and the rule that scales that link starts where a sliver’s face is larger than 1e-9 of a cell face, with a step there (8e-7 of the link’s weight in a test’s room).
Models:
Collada polygons with holes (
<ph>) are read with their holes filled.
Files and runs:
No limit on time. The numbers of rays have no upper bound: a mistyped count runs as long as it asks for. (The memory of a run’s late part is estimated before it starts, and a run whose late part would need more than the computer has is refused. The early stage’s is not estimated, and in a room of many facets with edge diffraction it is most of a run’s: BRAS CR3 peaks at 10.0 GiB in its edge fade (11.8 GiB in third-octave bands), which in third-octave bands starts each listener from less than 0.9 GiB; see Memory.)
Not validated yet
More measured rooms. Four rooms have been compared with measurements (see Measured rooms): their ISO 3382-1 parameters and G from seat to seat, and in three of them IACC with a dummy head. G’s absolute level has not, as BRAS’s calibration leaves the measured level uncertain by about 3 dB, nor the lateral parameters (LF, LFC, LG), stage support and directional decay, which BRAS did not measure, nor coupled rooms whose model joins them as the real ones are joined: in two-room diffuse theory BRAS’s two rooms are joined by about 1 m² more than their model from 250 Hz to 2 kHz, with the door ajar (10 to 16 times the model’s slit) and open alike.
Wave effects. Above the wave solver’s bands the simulation is geometric. Edge diffraction is modelled (UTD, for the direct sound and first-order reflections, and the direct sound over two edges; the fade of every other specular path at edges, which leaves some steps, see Known issues of the edge fade) and room modes by the wave solver, both checked against theory but not against measurements in rooms. Without the wave solver, results below the Schroeder frequency of a room (about 2000 √(T/V) Hz) are a statistical average, not the response of one point.
Source directivity was not part of the cross-check (both programs ran omnidirectional sources). The tests check that every pattern keeps the sound power, that SOFA and CSV data come out in the source’s frame, and that the direct sound, early paths, late rays and particles all follow the same weights.
Sound through walls is checked against diffuse-field theory, not against measurements. A wall is one sound reduction index per band for sound from all directions: sound passes straight on in its direction, with no flanking paths and no dependence on the angle it arrives at, and the wave solver does not model such walls: with
simulation.wave.enabled, a model with one stops with an error (openings are fine).Outdoor propagation is checked against geometry, closed forms, the exact solution for the reflection off a ground and one set of measurements, a wind turbine up to 845 m away in light to strong winds. A terrain is checked against the exact solution for a wedge, the flat ground, the image source in a slope and the thin screen’s closed forms, not against measurements over hills (see Terrain), and a rounded crest, which has no exact solution, is an engineering model; wind and temperature gradients cannot be combined with a terrain yet (see Outdoor scenes), and strong ones, where they matter most, are compared with a fast field program on the 1995 benchmark cases (see Outdoor sound in wind), not with measurements; the benchmark’s gradients that go on to a kilometre up bend sound through angles the engine’s default, narrow-angle parabolic equation does not carry, so beyond 1 to 2 km its pure tones stray there, though the bands it reports hold to 2 km, and the wide-angle one carries them (see The wide-angle parabolic equation). Weather that changes over the scene is checked against a parabolic equation marched through the zones, not against measurements, and a zone’s border is a step (see Weather zones). Barriers and buildings in wind are checked against a full-wave solution and a parabolic equation started from the exact field, both in the vertical plane with the wind blowing through the barrier, not against measurements, wind-tunnel data or Nord2000’s screen cases (see Barriers and buildings in wind). Levels over a long term are checked against the formulas they come from and against ISO 9613-2’s meteorological correction, not against long-term measurements, and are only as good as the weather classes and shares given to them (see Levels over a long term). Moving sources are checked against the exact field of a quasi-static source over a rigid ground, not against measured pass-bys, and leave out the convective amplification of a moving source (see Moving sources). The road vehicles’ sound power is CNOSSOS-EU’s table as published, and the siren’s level and directivity one measured siren’s, checked against the rules for sirens, not against measured pass-bys (see Sirens and road vehicles). The trains’ sound power is Schall 03’s as published: a pass in the engine is checked against Schall 03’s own sum, exact in a free field and 3.0 to 4.1 dB(A) under it over the railway example’s ground, which the two reckon otherwise, not against measured pass-bys (see Trains). The road works’ machines are rows of Defra’s database for construction sites as published, checked against the rows’ own levels and the EU’s limits, not against a measured site; the reversing alarm’s level is its rule’s (see Road works). A helicopter’s tones are checked against theory, its broadband noise against Pegg’s worked example, and the whole against one certified level, which it is 3.4 dB over (see Helicopter rotors); not against measured spectra or directivity. Vegetation is checked against a particle simulation of the same model, not against measurements through trees; its foliage takes ISO 9613-2’s rates, which the standard gives for depths of 20 to 200 m, or leaves as thin rigid discs, whose cross-section between its two closed-form limits is bridged, not exact, and which are compared with the standard’s table, not with measurements of leaves. Turbulence is checked against a parabolic equation through random eddies in two dimensions, with the source and the listener near the ground, not against measurements; how much the sound flickers over time is not checked against either. Between two moments of the eddies, a tone played through them, standing and along a walk with Doppler, is checked to have the response whose paths are delayed half-way (in the tests, to within 1 % of the tone’s amplitude). The wave solver in wind and temperature is checked against the parabolic equation over open ground up to 200 m, not against measurements, nor round buildings; its moving air against the exact field in a uniform wind, its wind round a dome against an ideal fluid’s and a façade’s echo against ray theory through that wind, not against a measured wind round a building, whose wake it leaves out (see Moving air). The level relative to free field and a barrier’s insertion loss are checked against exact solutions, not against measurements; the path reflected both before and after a barrier is checked over a rigid ground only, and the sound that goes over a barrier, down to the ground and over it again is left out (see Outdoor results).
Spatial outputs are checked against closed forms and energy balances, not by listening tests.
Speed on a hardware GPU. CI checks the wave solver’s and the late stage’s GPU paths on software and virtual GPUs (Mesa’s software Vulkan driver on Linux, Direct3D 12’s WARP on Windows and the virtual machines’ Metal GPUs on macOS), which shows that they agree with the CPU, not how fast they are;
validation/wave_gpu.py,validation/late_gpu.pyandvalidation/outdoor_gpu.pytime them on your own GPU.
Reproducing
python -m pip install pyroomacoustics matplotlib
python validation/pyroomacoustics_crosscheck.py --json results.json --plots docs/validation
python validation/convolver_benchmark.py
python validation/wave_solver.py --plot docs/images/wave.png
python validation/wave_walls.py --json wave_walls.json   # 41 to 51 min; --walls picks the kinds
python validation/edge_diffraction.py --json diffraction.json
python validation/edge_fade.py --json edge_fade.json
python validation/walks.py --json walks.json   # --walks gallery archway street
python validation/ground_reflection.py --wave --parabolic --extended --json ground.json
python validation/outdoor_propagation.py --json outdoor.json --plots docs/validation
python validation/outdoor_propagation.py --turbulence moderate
python validation/outdoor_propagation.py --still   # the same cases in still air
python validation/turbulence.py --json turbulence.json
python validation/turbulence.py --profile --json turbulence_profile.json
python validation/vegetation.py --json vegetation.json
python validation/leaves.py --json leaves.json
python validation/wave_outdoor.py --json wave_outdoor.json
python validation/wave_wind.py --json wave_wind.json   # --skip-profiles: no parabolic equation
python validation/insertion_loss.py --json insertion_loss.json
python validation/terrain.py --json terrain.json
python validation/ffp.py --json ffp.json
python validation/curved_rays.py --json curved_rays.json   # about 30 min
python validation/benchmark_1995.py --json benchmark.json   # --far: whole scenes to 10 km
python validation/open_ground_frequencies.py --json open_ground.json   # --cache DIR --part K/N to share it
python validation/steep_sound.py --json steep_sound.json   # about 2.3 h; --only steps: the range step's check
python validation/weather_zones.py --json weather_zones.json   # --only pe or mean
python validation/barrier_wind.py --json barrier_wind.json   # about 4 h; --quick: fewer bands
python validation/rows.py --engine --json rows.json   # --references: the wave calculation again
python validation/long_term.py --json long_term.json
python validation/doppler.py --json doppler.json
python validation/rotorcraft.py --json rotorcraft.json
python validation/urban_sources.py --json urban_sources.json
python validation/rail_sources.py --json rail_sources.json
python validation/plant_sources.py --json plant_sources.json
python validation/doc29_reference.py --workbook doc29-volume3-part1-workbook.xlsx
python validation/aircraft_noise.py --json aircraft_noise.json
python validation/fta_vibration.py
python validation/city_speed.py --json city_speed.json   # --sizes 10 20 30 40 60
python validation/wave_gpu.py   # needs the gpu extra and a GPU driver
python validation/late_gpu.py   # the late stage on each device, and its parameters
python validation/outdoor_gpu.py   # the outdoor examples on each device: levels and centre times
python validation/rays_gpu.py   # the ray searches alone, and whether both find the same faces
python validation/late_memory.py   # the late part's memory against its estimate (Linux)
python validation/bras_validation.py --json bras.json --plots docs/validation
python validation/bras_validation.py --materials initial --plots docs/validation
python validation/bras_validation.py --bands third_octave --json bras_third.json
python validation/bras_validation.py --materials initial --calibrate LS1 --plots docs/validation
python validation/bras_binaural.py path/to/BRAS --json binaural.json   # FABIAN's responses from BRAS
python validation/bras_iacc_parts.py path/to/BRAS CR3 LS7   # one loudspeaker's response in parts
python validation/coupled_rooms.py --results bras.json   # CR1 against two-room diffuse theory
python validation/coupled_rooms.py --scene CR1_DoorAngle3 --results bras.json
python validation/bras_room_energy.py --results bras.json   # what scattering does, rooms' own decay
On 4 cores of a cloud machine without a GPU, each run alone on the machine (30 and 31
October 2026), the cross-check takes about 10 minutes, the convolver benchmark half a
minute, the wave solver’s checks 3.0 minutes (both stencils, 11 November), the edge
diffraction’s 40 seconds, the fade at edges’ 53 minutes, the walks’ 14, the ground’s 5.5 (51 s of them
the wave solver’s, 100 s the parabolic equation’s), the outdoor measurements’ 3.1 (3.0
with turbulence, 20 seconds in still air), the turbulence’s 3.9 (3.8 with --profile),
the vegetation’s 5.2, the leaves’ 2.6, the wave solver’s outdoors 12.6 and the moving
air’s 12.3 (both 10 November), the insertion loss’s 1.8, the terrain’s 41 seconds
(2 November), the fast field program’s 5.7, the benchmark’s 55 (much longer with --far), the weather zones’ 7.2
(46 s of them the parabolic equation’s, 6.4 minutes the mean profile’s), the long term’s
16 seconds, the moving sources’ 5.6 minutes, the rotors’ 3.3, the sirens’ 4 seconds, the
cities’ 22 (1.3 minutes with --sizes 10 20 30 40 60), each BRAS run of the coupled
rooms, the seminar room or the auditorium 2 to 4 minutes (4 to 9 calibrated, 5 to 11 in
third-octave bands) and of the hall about 1.5 hours (5.2 calibrated, 3.4 in third-octave
bands), the binaural comparison 10 minutes in the seminar room, 6 in the auditorium and
an hour in the hall, a loudspeaker of the hall in parts about 10 minutes, the coupled
rooms against theory under a second, and the rooms’ own decay 5.8 minutes. Since then
the open ground’s parabolic equation in wind runs up to 2 kHz, its bands carry its field
through the crossovers and over the open ground each listener’s run marches under the
absorbing layer of a run for it alone: on 16 November, on another machine of the kind, the outdoor
measurements took 28 minutes (the cases already downloaded, without the plots), the
long term 1.6 and the benchmark 93 (the sum of its parts, each timed alone); the others
listed here do not reach that part of the engine. Since 11 November the ray tracer and the wave solver do less work on the
CPU for the same results: the seminar room’s BRAS run takes 10 to 12 % less, and of the
others only the wave solver’s checks were timed again.
The cross-check’s numbers come from 4.0.1 with seed 1;
this version’s own are within 0.012 % of them (EDT, whose line fit now starts at the
onset in every response).
pyroomacoustics draws its rays afresh on every run, so the script averages five runs of it
(--pra-runs); the means still move by a few percent from one call to the next, and the
differences in the tables with them. Other seeds move this package’s numbers by a few
percent.